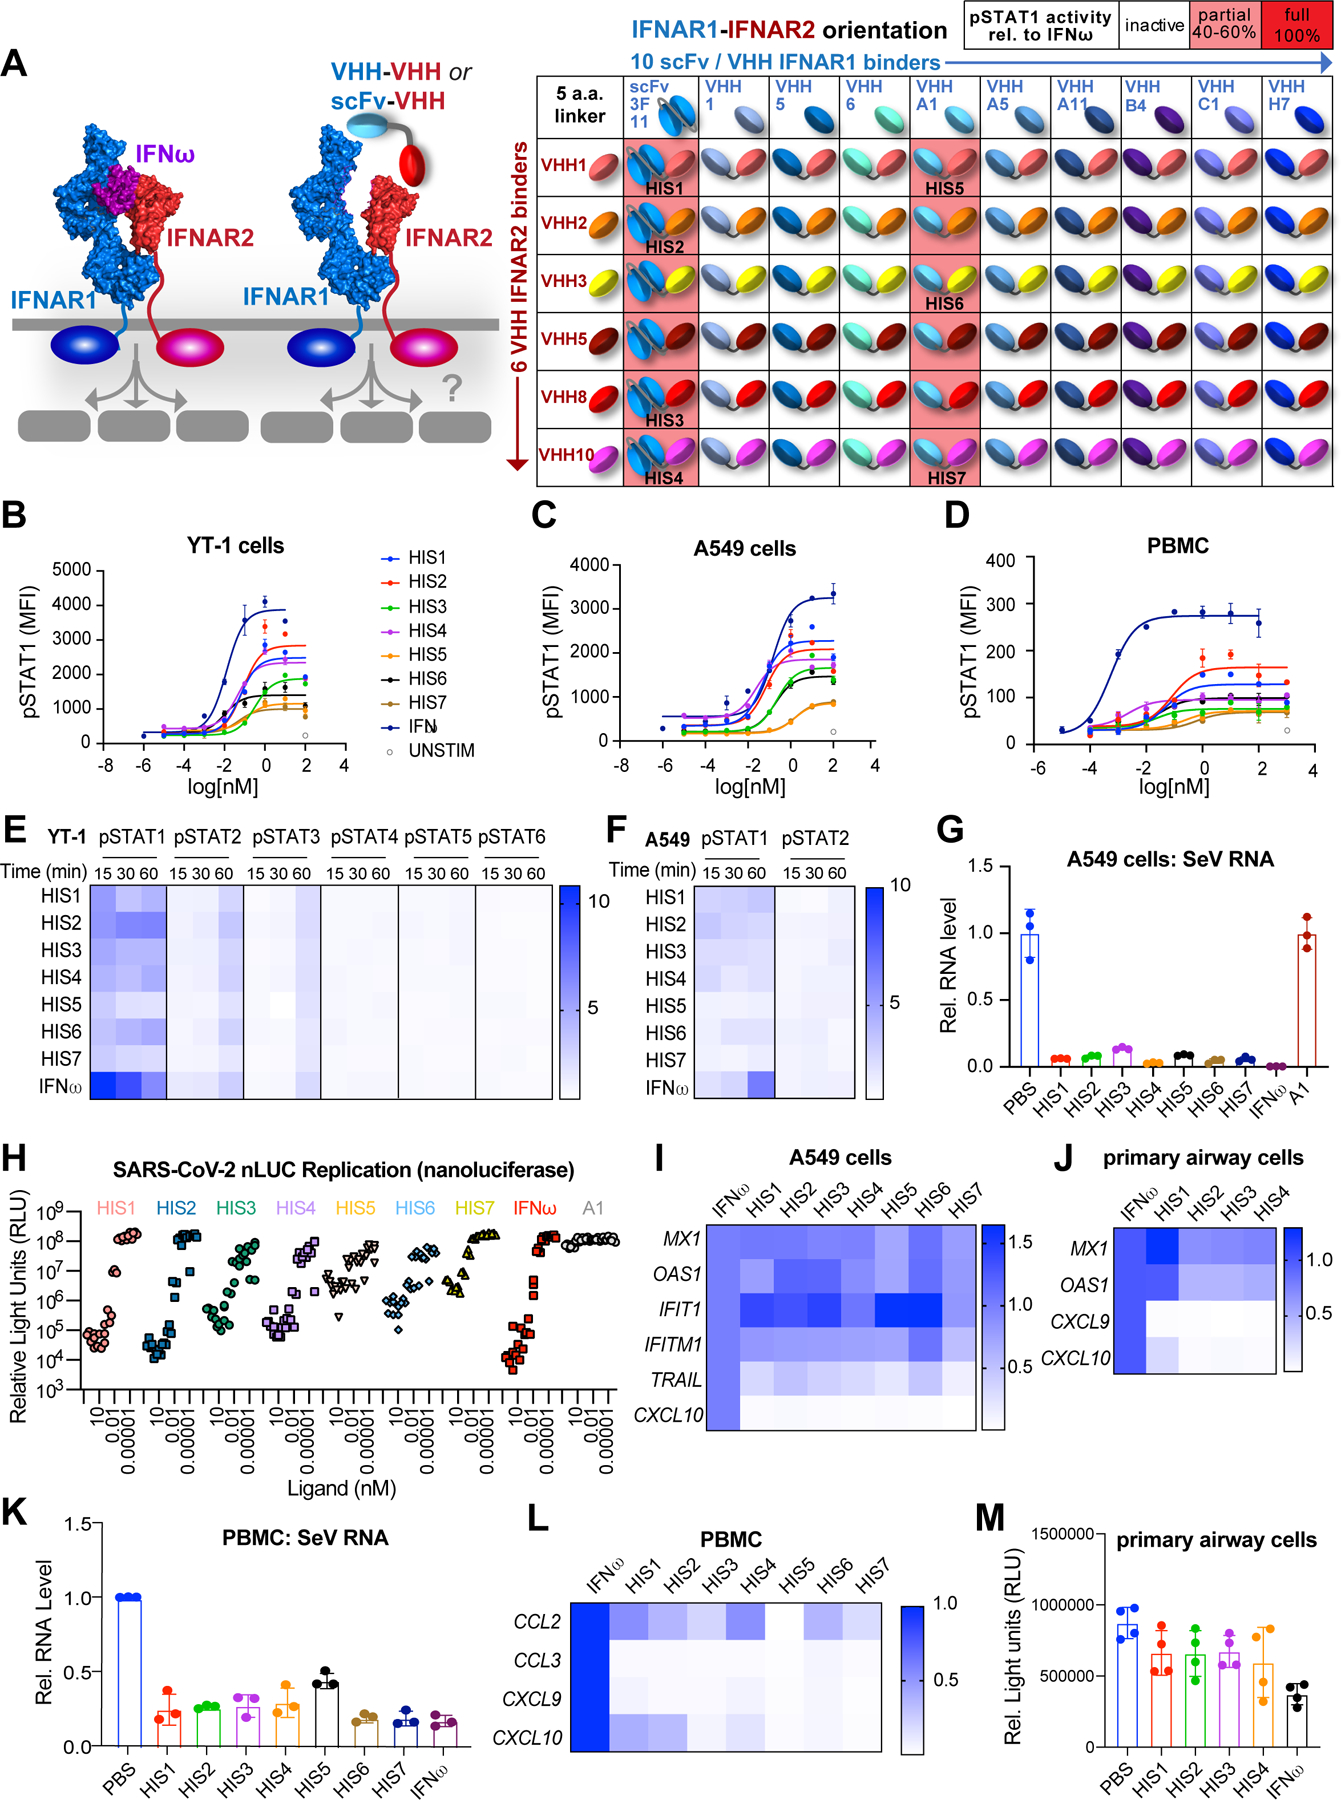
Figure 6. Type I Interferon surrogate agonists exhibit biased signaling and inhibit viral replication.

(A) Schematic representation of bispecific type I IFN surrogate ligands which heterodimerize IFNAR1 and IFNAR2 (left). A collection of 11 IFNAR1 binders (1 scFv, 10 VHH) were paired with 6 IFNAR2 binders (VHH), resulting in 66 combinations of IFNAR1-IFNAR2 fusion molecules connected via a 5 a.a. linker (right). Twelve of these molecules induced pSTAT1 activity on YT-1 cells (pink shading). The IFNAR2-specific scFv “3F11” was identified from the patent US7662381B2 (Cardarelli et al., 2010). Seven of the hits, “HIS1–7,” were selected for further analysis. (B-D) Dose-response relationship of STAT1 phosphorylation evoked by IFNω or surrogate agonists. YT-1 cells (B), A549 cells (C), or PBMCs (D) were stimulated with saturating ligand concentration for 20 min., fixed and permeabilized, then stained with α-STAT1(pY701)-AlexaFluor647 and analyzed via flow cytometry. (E) Heatmap representation of STAT1-STAT6 phosphorylation evoked by surrogate agonists in YT-1 cells at different time points and normalized to the activation induced by IFNω. (F) Heatmap representation of STAT1 and STAT2 phosphorylation evoked by HIS in A549 cells at varying time points, normalized to activation induced by IFNω. (G) qRT-PCR analysis of SeV RNA in A549 cells pre-treated with 10nM HIS or IFNω for 24hr. followed by SeV infection (MOI=0.1) for 24hr. (H) SARS-CoV-2 nLUC A549-hACE2 Antiviral Assay. A549-hACE2 cells were treated with varying concentration of HIS, IFNω, or negative control (monomer VHH “A1”) for 24hr. prior to infection with SARS-CoV2 nLUC. SARS-CoV-2 nLUC replication (relative light units) for triplicate wells per VHH dilution is shown. (I-J) Heatmap representation of selected ISGs induced by HIS in A549 cells (I) or human primary bronchial/tracheal epithelial cells (J). Gene expression is normalized to the level induced by IFNω. (K) qRT-PCR analysis of SeV RNA in PBMCs pre-treated with 10nM HIS or IFNω for 24hr. followed by SeV infection (MOI=0.5) for 24hr. (L) Heatmap representation of selected ISGs induced by HIS in PBMCs. (M) CellTiter-GLO assay of human primary bronchial/tracheal epithelial cells treated with 10nM HIS or IFNω for 72hr.
See also Figure S6.
