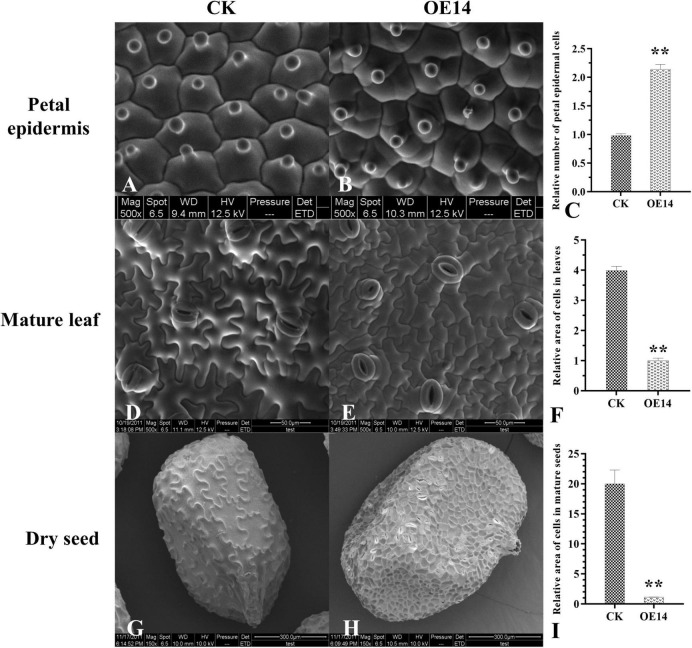
FIGURE 6.
Comparative analysis of cell size between CK and transgenic (OE14) tobacco by environmental scanning electron microscope (ESEM). (A,B) ESEM observation of the petal epidermis between CK and transgenic (OE14) line. (D,E) ESEM observation of the abaxial epidermis of the leaves between CK and transgenic (OE14) line. (G,H) Microscopic observation of dry seeds between CK and transgenic (OE14) line. (C,F,I) Statistical analysis of the petal epidermis, mature leaf, and seed coat cells between CK and transgenic (OE14) lines. Asterisks on the column diagram showed the significant difference between different samples (p < 0.01).

