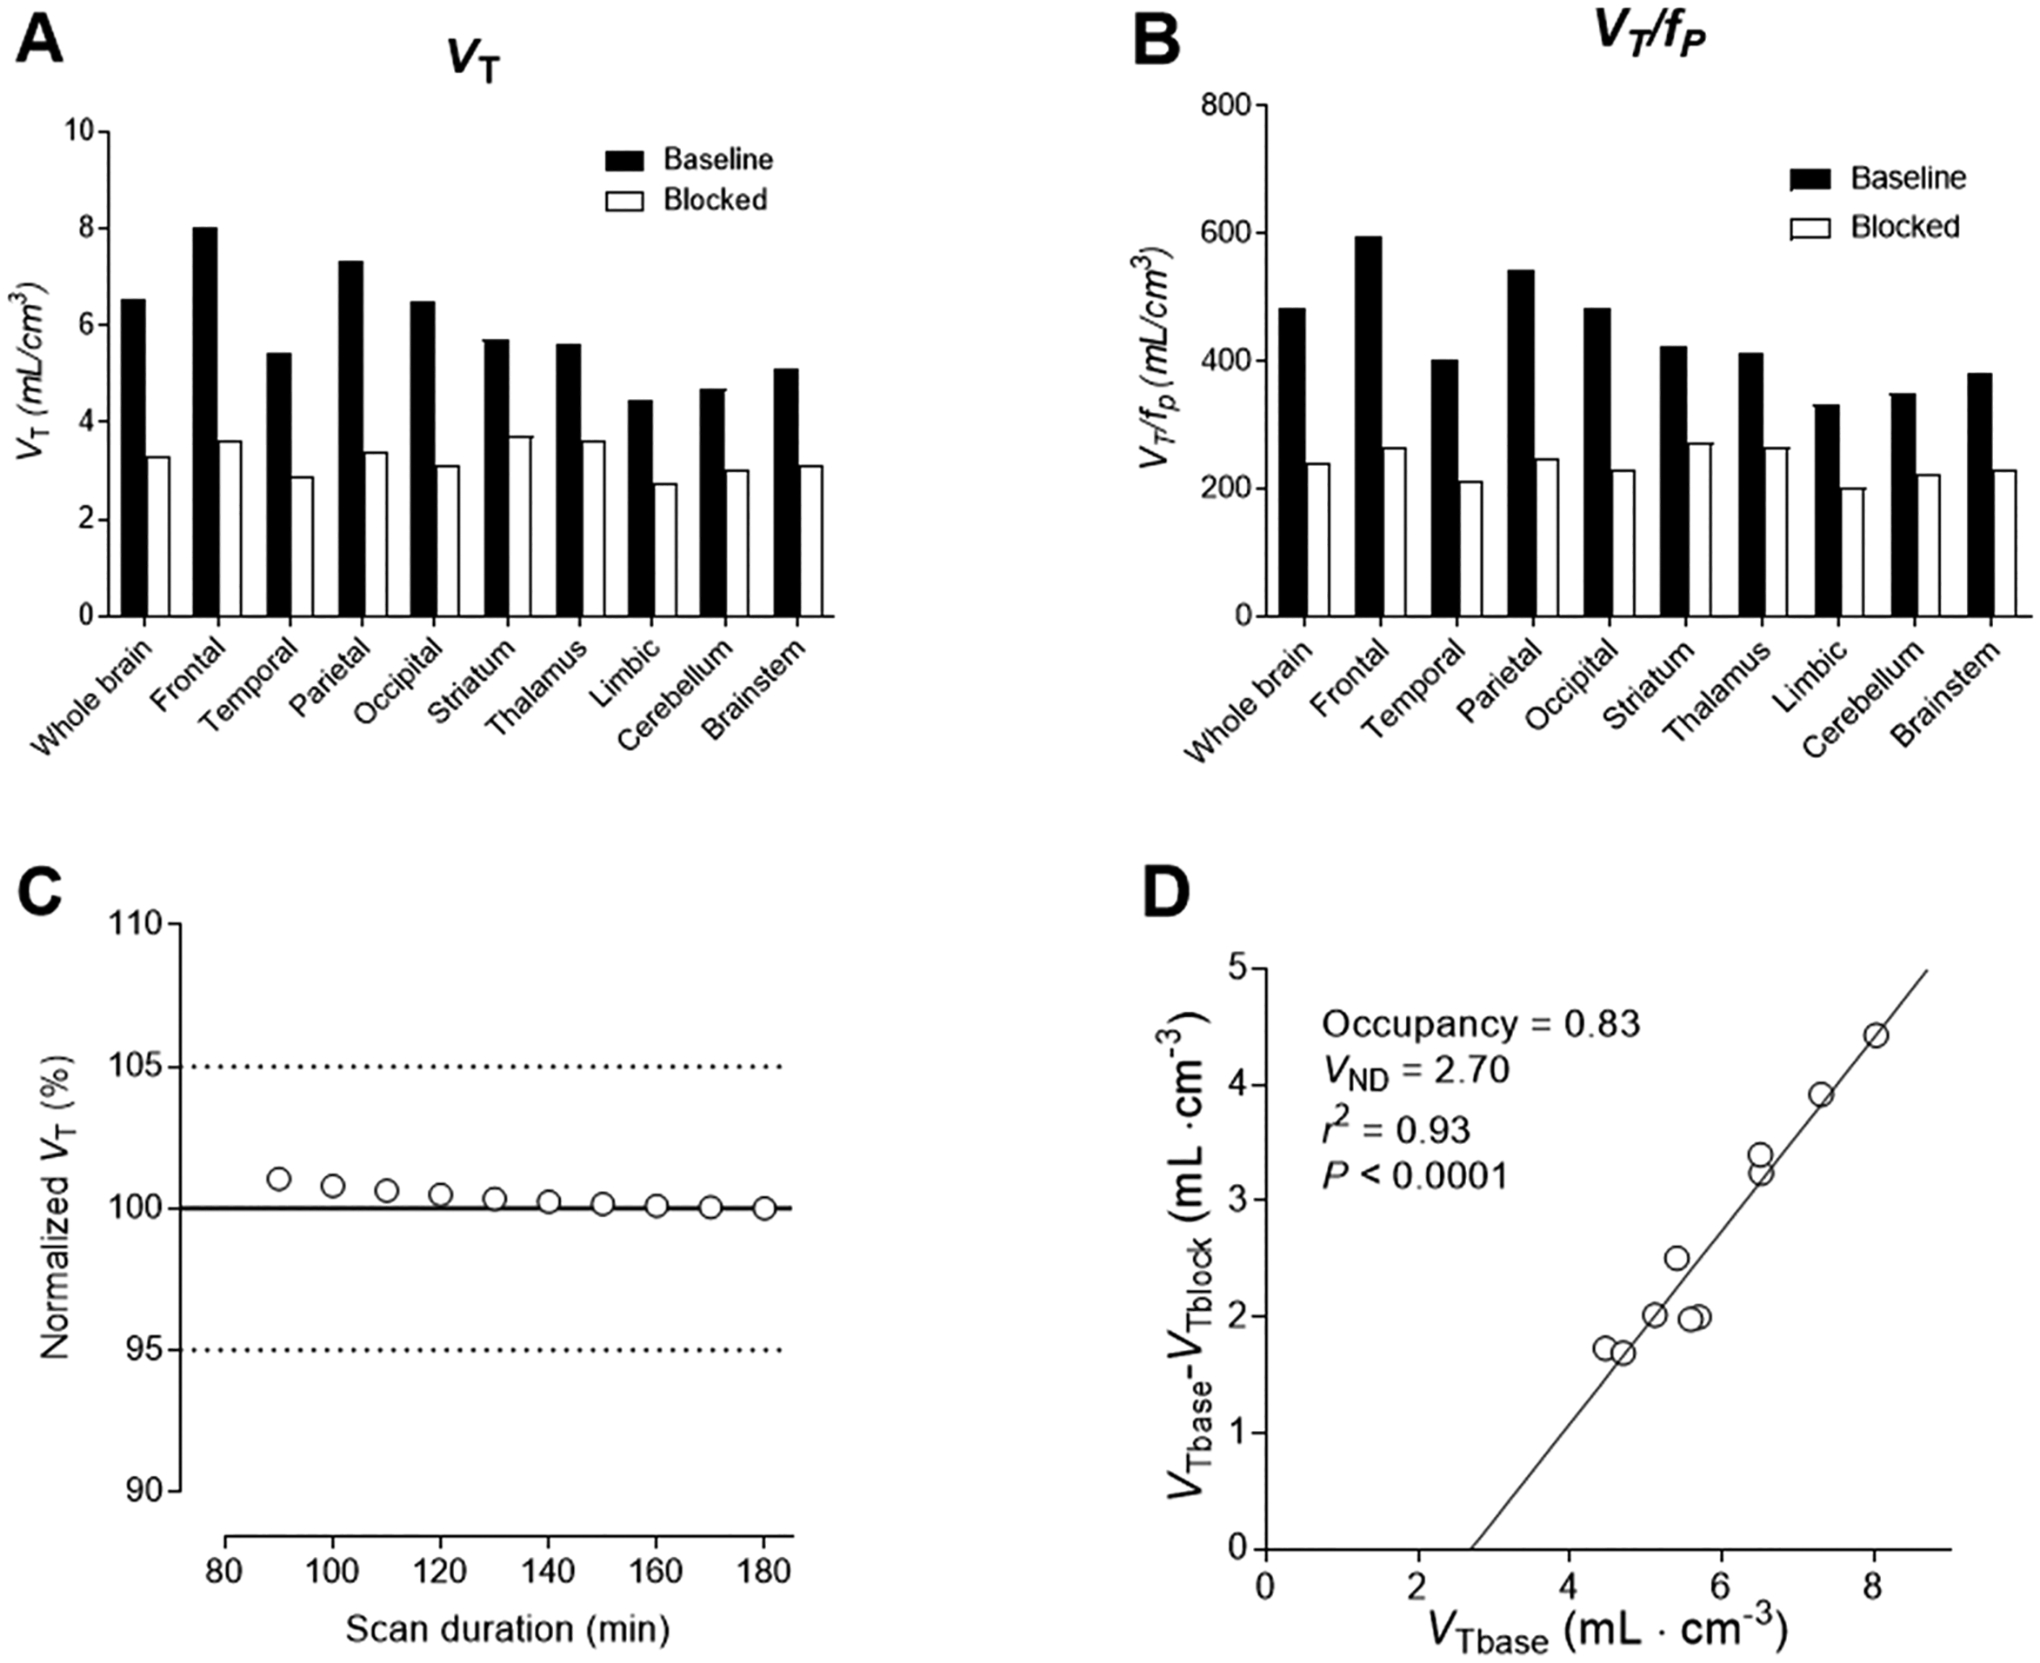
Figure 8.

Analysis of PET data from monkey A under baseline and preblock conditions. Panel A: regional VT values. Panel B: regional VT values adjusted for normalized plasma free fraction (Supporting Information, Table S1). Panel C: VT values determined from PET data for different durations of scan data from time of radioligand injection, normalized to the value at the end of scanning (180 min). Panel D: Lassen plot showing VND as the X-axis intercept and occupancy (slope of plot) of the available COX-1 (that not already occupied by carrier at baseline) by the blocking agent PS13 (0.3 mg/kg, i.v.).
