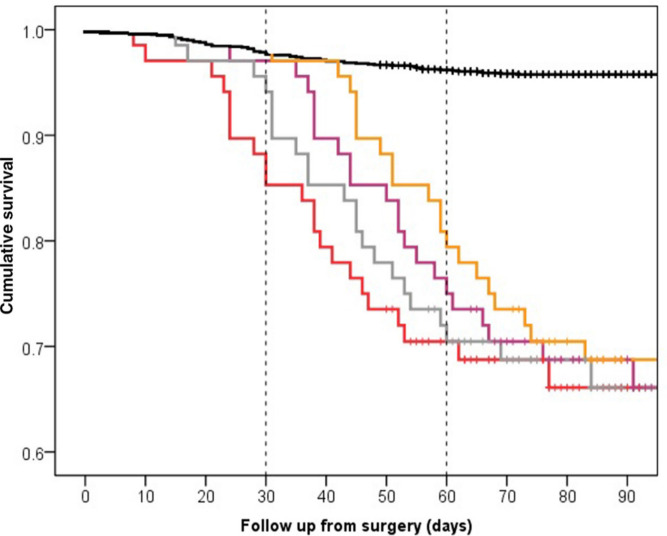
Fig. 7.
Kaplan–Meier survival curves for patients with (n=68, red line) and without (n=1501, black line) perioperative coronavirus disease 2019 (COVID-19) perioperatively, using data from Clement et al. 7 The grey, purple, and orange lines indicate hypothesized seven, 14, and 21 day delays in time of acquiring COVID-19, respectively. This graph shows the effect on the rate of 30- and 60-day mortality rates, with an approximate variation of 10% in cumulative survival rates.

