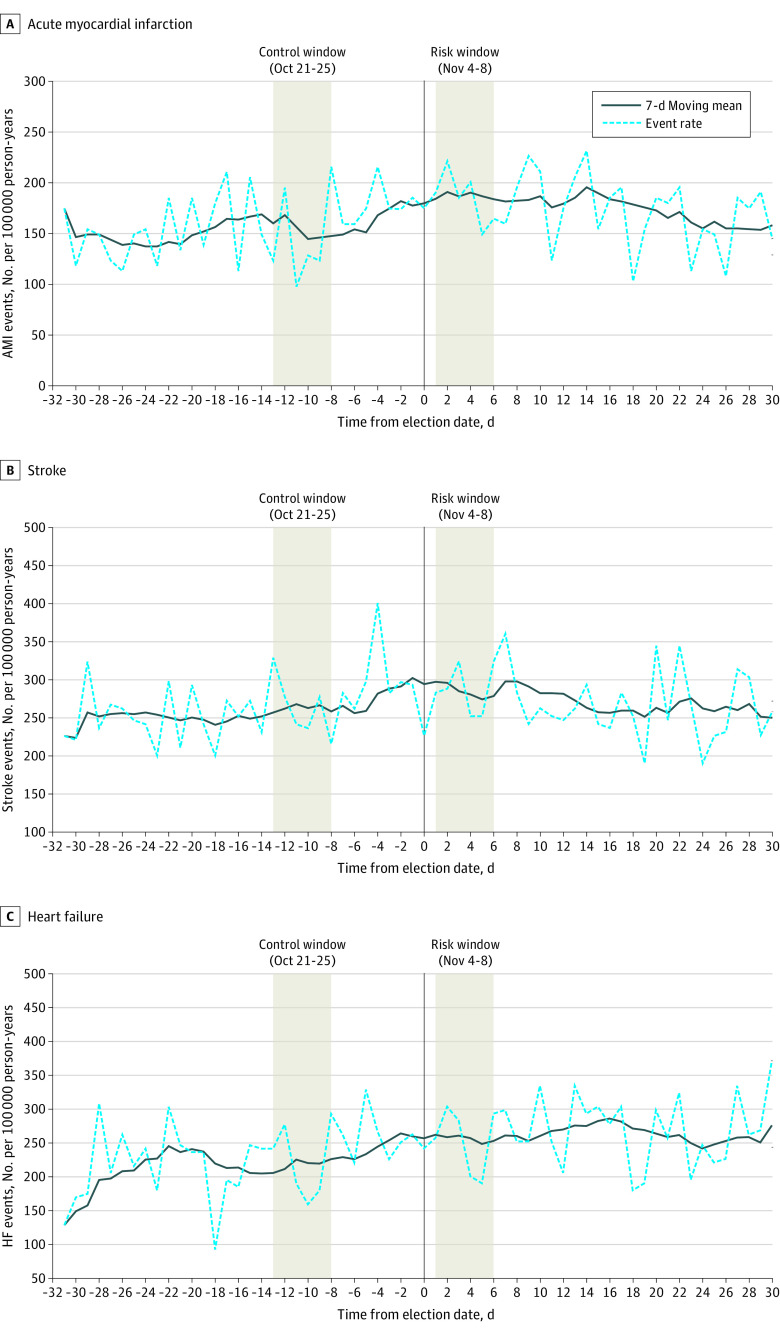
Figure 2. Hospitalization for Acute Myocardial Infarction (AMI), Stroke, and Heart Failure (HF) Events per 100 000 Person-Years in the Month Preceding and After the 2020 Presidential Election.
Rates of AMI (panel A), stroke (panel B), and HF (panel C) per 100 000 person years are presented 30 days before and after the date of the 2020 presidential election (0 = date of the 2020 presidential election). Absolute event rates are presented by a dashed line, with a 7-day smoothing average presented as a solid line. Rates in the risk window (November 4-8) and the control window (October 21-25) are highlighted.

