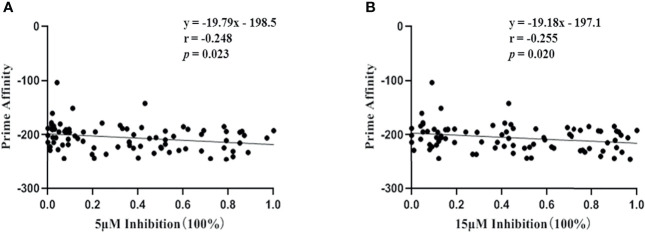
Figure 3.
Correlation coefficient between bioinformatics analysis and peptide competitive binding assay for HLA-A molecules. Vertical axis represented the prime affinity of 45 validated epitope with corresponding HLA-A allotypes calculated by bioinformatics analysis, while horizontal axis represented the binding affinity of identical validated epitopes with corresponding HLA-A allotypes detected by peptide competitive binding assay for HLA-A molecules using transfected HMy2.CIR cell lines. The percentages of inhibition efficacy in peptide competitive binding assay were transformed into 0 to 1.0 for the Pearson correlation analysis (for gaussian data). (A) Correlation of bioinformatics analysis with the peptide competitive binding assay under 5μM of VEP. (B) Correlation of bioinformatics analysis with the peptide competitive binding assay under 15μM of VEP. p<0.05 means that the correlation analysis had statistical significance.

