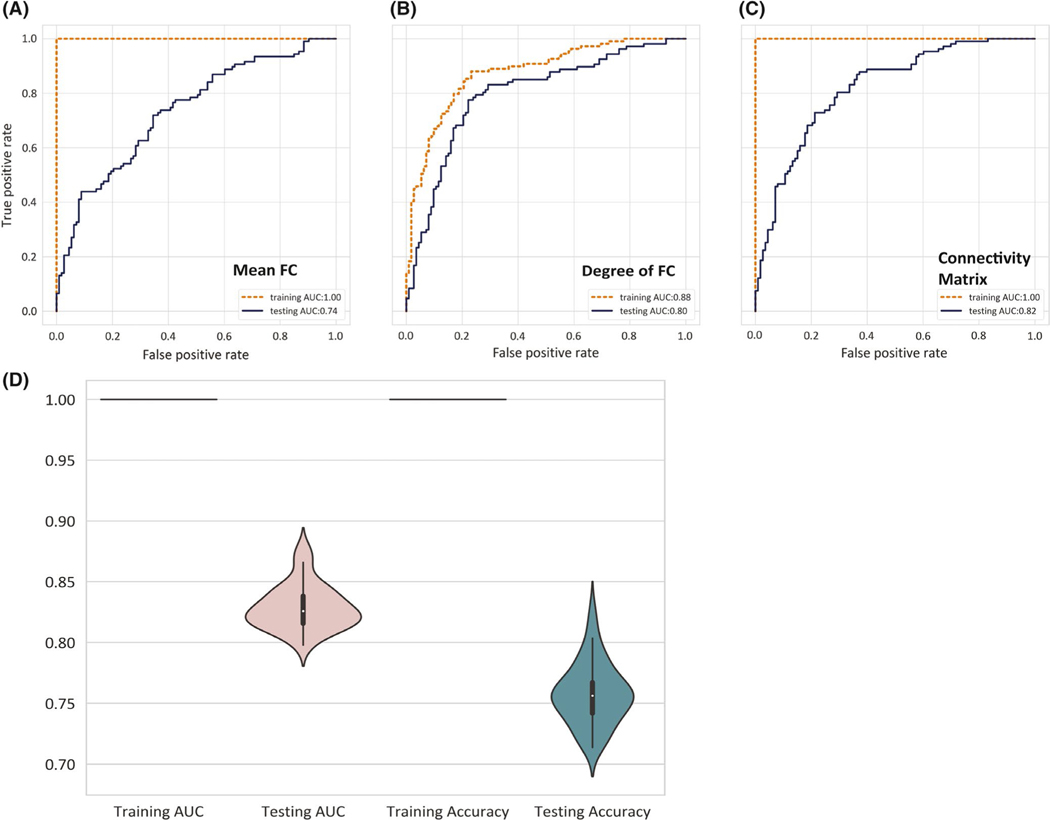
FIGURE 2.
Classification performance for epilepsy versus control analysis. Receiver operating characteristic curve analysis for epilepsy versus control classification compares (A) mean functional connectivity (FC), (B) degree of FC, and (C) connectivity matrix. Comparison of training and testing sets are illustrated by color lines (Orange: testing, Navy blue: training). Models in A and B include features from the Schaefer 400-parcel cortical atlas and 14 subcortical regions from the Harvard–Oxford atlas,25 whereas C uses only the connectivity matrix between Schaefer cortical atlases. (D) Violin plot represents the distribution of training and testing accuracies and area under the curve in 50 reiterations

