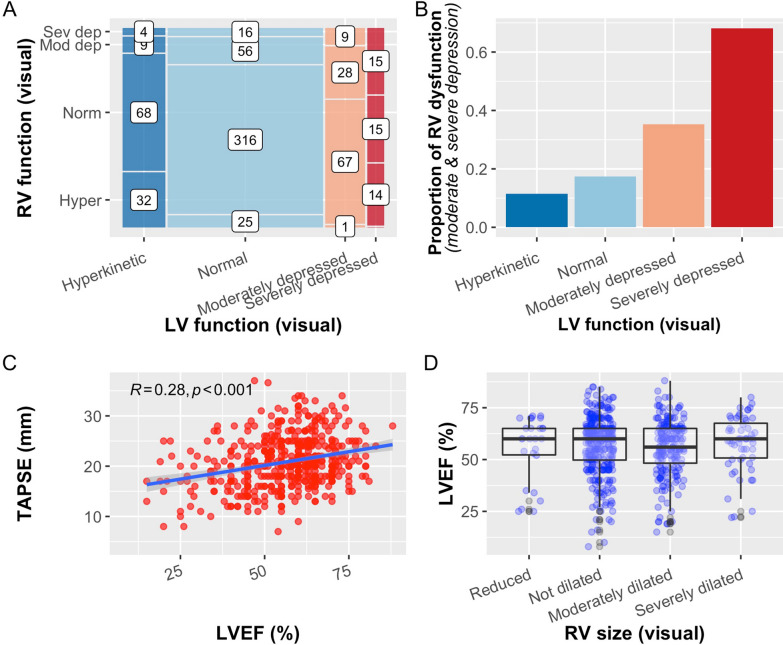
Fig. 1.
A Mosaic plot for number of patients with different combinations of RV and LV functions (Hyper hyperkinetic, Norm normal, Mod dep moderately depressed, Sev dep severely depressed). Number denotes number of patients for each category. B Proportion of patients with depressed RV function with different LV function, both assessed visually. C Relationship between LVEF and TAPSE. The blue line shows the fitted linear regression line. Pearson correlation (R) is shown. D LV ejection fraction (LVEF) vs RV size

