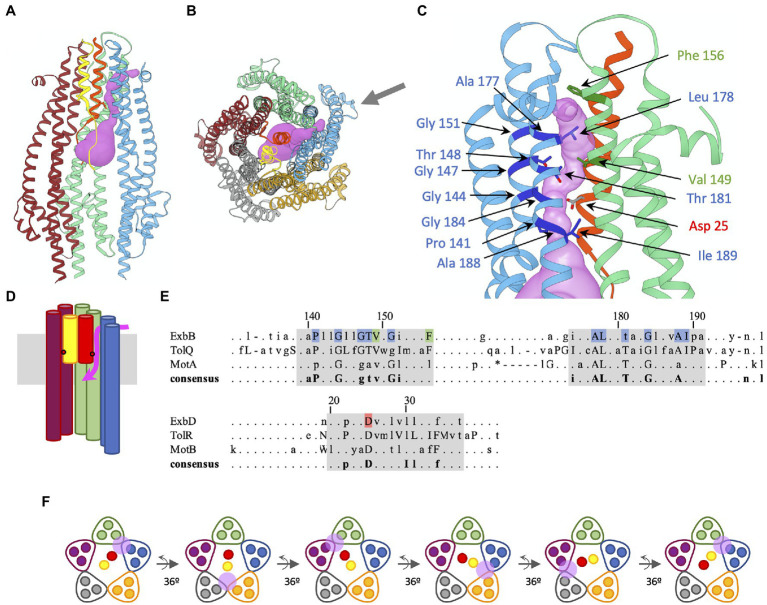
Figure 2.
Predicted proton channel in EcExbBD, sequence conservation of residues lining the channel, and rotary model of the ExbD TMs in the ExbB pentamer. The color coding of the different subunits is the same as in Figure 1. (A) Ribbon representation of the EcExbBD complex (pdb 6TYI), with the predicted proton channel represented as pink isosurface. For clarity, two ExbB subunits (grey and orange) have been omitted to reveal the interior of the complex. The blue and green EcExbB subunits are involved in the channel formation. The TM helices of EcExbD are colored yellow and red, with the side chains of the essential Asp25 represented as ball and sticks. The red helix is involved in the formation of the channel. (B) Same ribbon representation as (A), but viewed from the periplasm, all the EcExbBD subunits are shown. The online version of Mole 2.5 (https://mole.upol.cz/; Pravda et al., 2018) was used to probe for cavities and channels in the EcExbBD structure. The same parameters reported for the CjMotAB channel (Santiveri et al., 2020) were used: 1 Å radius bottleneck, and omission of Leu178 side chain for the calculation. The black arrow shows the direction of viewing for (C). (C) Enlarged view of the channel. Only the EcExbB and EcExbD subunits involved in the channel formation are shown (blue, green, and red). The most conserved residues in the consensus sequence shown in (E) are highlighted in darker colors and side chains are shown as ball and stick. (D) Schematic representation of (A), showing the path of the channel. Only the TMs 2 and 3 of the blue, green, and purple EcExbB subunits are shown. The approximate location of the conserved Asp on EcExbD TM is shown with red dots. The membrane is shown in grey. The channel is symbolized in pink. It opens between the blue and green EcExbB subunits on the periplasmic side, connects to the Asp25 of the red EcExbD TM, and opens on the cytoplasmic cavity of the EcExbB pentamer. (E) Consensus from the multiple sequence alignment of ExbB/TolQ/MotA last two TM domains and ExbD/TolR/MotB TM domain, adapted from Figure 4 from Cascales et al. (2001). Lowercase letters represent residues present in the 60% consensus and uppercase letters for residues in the 90% consensus. Gaps are marked “–” and “*” when present in the 90 and 60% consensus, respectively (Cascales et al., 2001). The numbering corresponds to the E. coli sequences of ExbB and ExbD. The highlighted residues in blue, green, and red are the ones shown with arrows on (C). They all are in the 90% consensus range, except for Thr181. The regions highlighted in grey correspond to the last two TMs of ExbB, TolQ, and MotA, and the single TM of ExbD, TolR, and MotB. (F) Rotary model of ExbBD. The view is the same as in (B) and shows a schematic slice of the TM domains of ExbB and ExbD. The positions of the proton channel are shown with the pink circle. The cycle starts with the channel opening between the green and blue ExbB subunits. The proton travels to the conserved Asp on the red ExbD TM, inducing a conformational change resulting in the rotation of the two ExbD TMs by 36°. The conformational changes lead to the closure of the channel between the green and blue ExbB subunits, while a new channel opens between the grey and orange ExbB subunits. A second proton now travels to the Asp on the yellow ExbD TM, resulting in a new rotation of 36°. The channel between the grey and orange ExbB subunits closes, while a new channel opens between the purple and green subunits, allowing a third proton to travel to the Asp on the red ExbD TM. The rotation can proceed as long as the channels are in the open state. Molecular graphics have been performed with UCSF Chimera (Pettersen et al., 2004).

