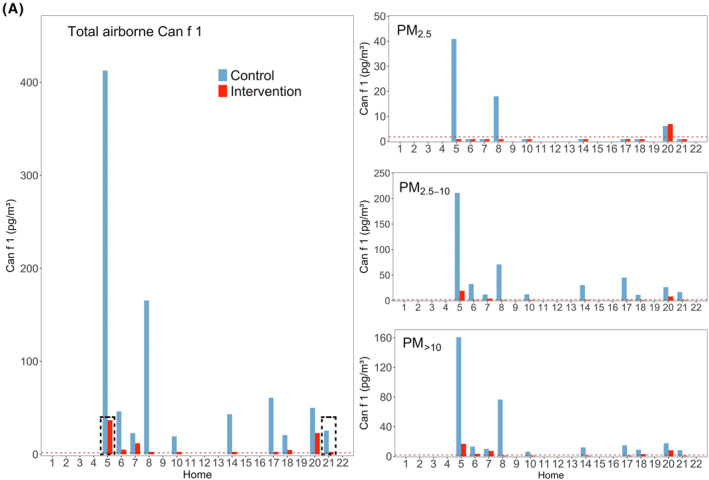
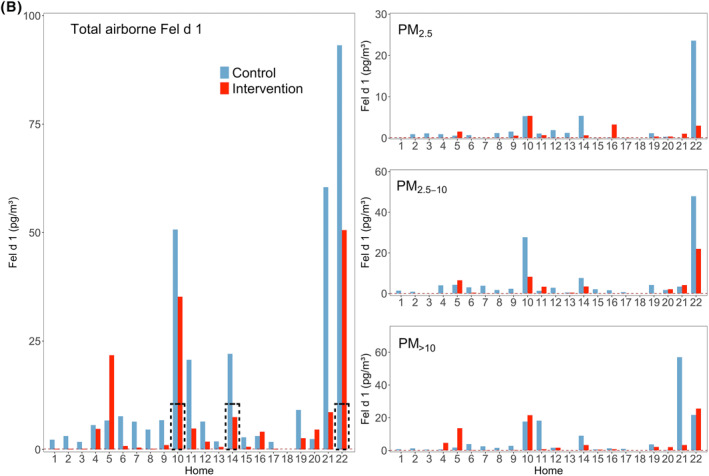
FIGURE 3.
(A) Airborne concentrations of Can f 1 (dog allergen), control and Intervention visits (n = 10). Left: Total airborne allergen (sum of all size fractions). Right: Concentrations for each size fraction. Dashed red lines represent the LOQs. Dashed black rectangles show the presence of a dog in homes. Empty homes mean that they did not meet the criteria to be analyzed, according to section Allergen Sampling. (B) Airborne concentrations of Fel d 1 (cat allergen), control and Intervention visits (n = 21). Left: Total airborne allergen (sum of all size fractions). Right: Concentrations for each size fraction. Dashed red lines represent the LOQs. Dashed black rectangles show the presence of a cat in homes. Empty homes mean that they did not meet the criteria to be analyzed, according to section Allergen Sampling


