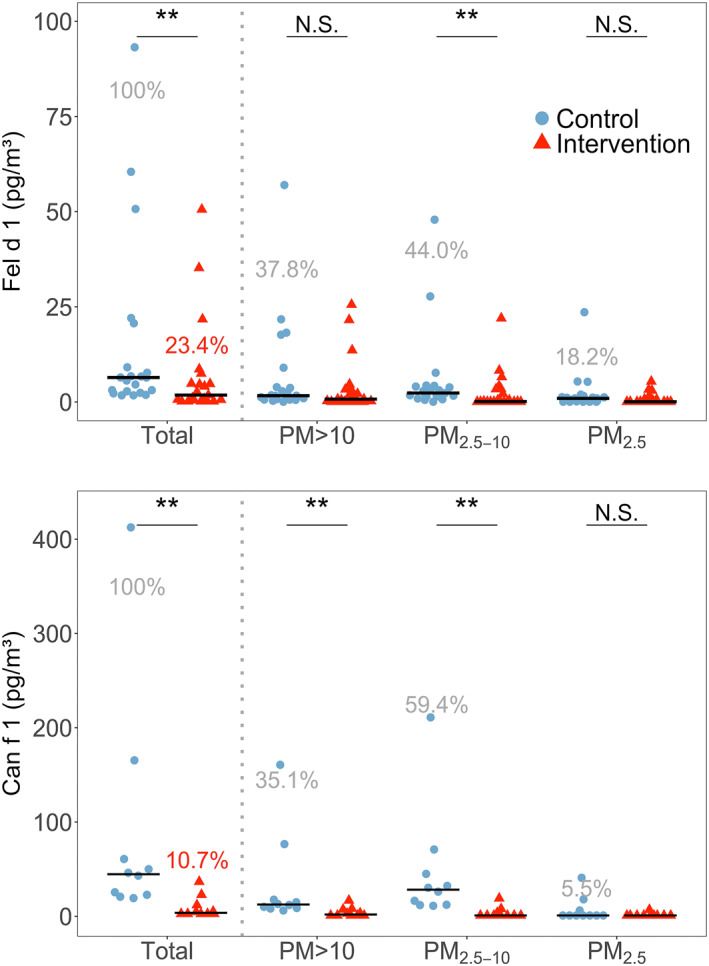
FIGURE 4.

Total airborne concentrations of Fel d 1 (upper) and Can f 1 (lower) and each size fraction, during control and intervention visits. Horizontal black bars represent the medians. N.S, *, ** and *** represent p‐values > 0.05, ≤0.05, ≤0.01 and ≤0.001, respectively. Percentages in grey show averaged allergen distribution across the three size fractions regarding the correspondent allergen sum. Percentages in red show the remaining allergen after intervention
