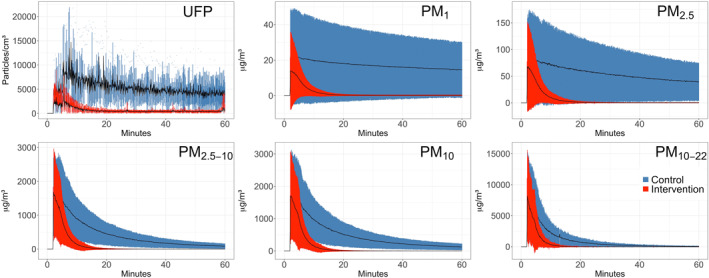
FIGURE 5.

Change of PM in the bedrooms over the course of 1 hour following dust disturbance, with air filtration running (Intervention, red) versus without air purifier (Control, blue). Each curve represents the average of the four repetitions (all homes) for the different size fraction as indicated in each graph. Mean ± SD are given
