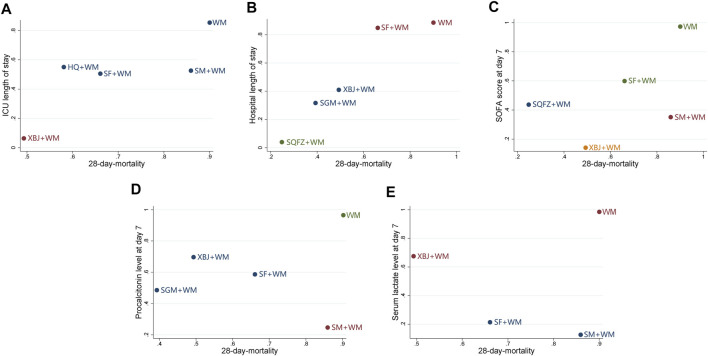
FIGURE 5.
Cluster analysis plots (A) 28-days-motality (x-axis) and ICU length of stay (y-axis) (B) 28-days-motality (x-axis) and hospital length of stay (y-axis) (C) 28-days-motality (x-axis) and SOFA score at day 7 after interventions (y-axis) (D) 28-days-motality (x-axis) and procalcitonin level at day 7 after interventions (y-axis) (E) 28-days-motality (x-axis) and serum lactate level at day 7 after interventions (y-axis); WM, Western Medicine; SF, Shenfu injection; SM, Shenmai injection; SGM, Shengmai injection; XBJ, Xuebijing injection; HQ, Huangqi injection; SQFZ, Shenqifuzheng injection. Interventions with the same color belong to the same cluster, and interventions located in the lower-left corner indicate the optimal therapy for two different outcomes while located in the upper-right corner indicate the worst therapy.

