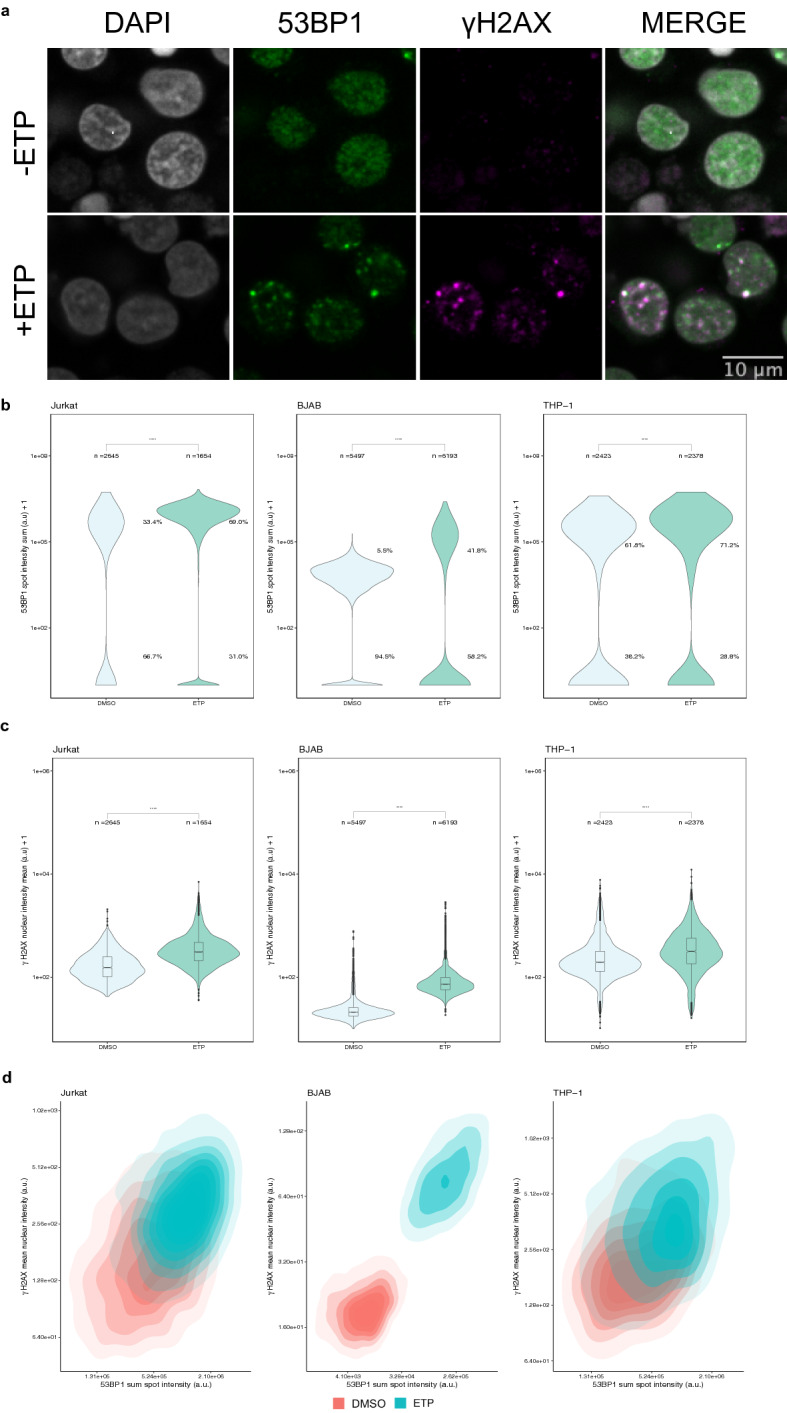
Figure 2.

Detection of DNA damage in immune cell lines using HTI. (a) Jurkat cells were either treated with DMSO or treated with 30 µM etoposide (ETP) for 1.5 h before being subjected to HTI. DNA damage sites are indicated by an increase in signal intensity and foci formation of 53BP1 and γ-H2AX detected by specific antibodies. Scale bar: 8 µm. (b) Distribution of 53BP1 sum spot intensity in DMSO- or ETP-treated cells. Values indicate percentages of cells in the indicated populations. ****: p < 0.0001. (c) Distribution of γ-H2AX mean nuclear intensity in DMSO or ETP-treated immune cells. ****: p < 0.0001 using Mann–Whitney-Wilcoxon test. Number of analyzed cells (n) indicated for each sample. The values are representative of at least 3 independent experiments. Boxes represent the first and third quartiles of the distribution, the line represents the median and the whiskers represent the highest and lowest data points within 1.5 times the interquartile range (IQR) above the upper quartile and below the lower quartile. (d) Two-dimensional kernel density contour plots of the correlation between 53BP1 sum spot intensity and γ-H2AX mean nuclear intensity for both ETP-treated (blue) and untreated (red) immune cell lines for the dataset shown in panels B and C. N = 3 wells per sample with at least 197 cells per well.
