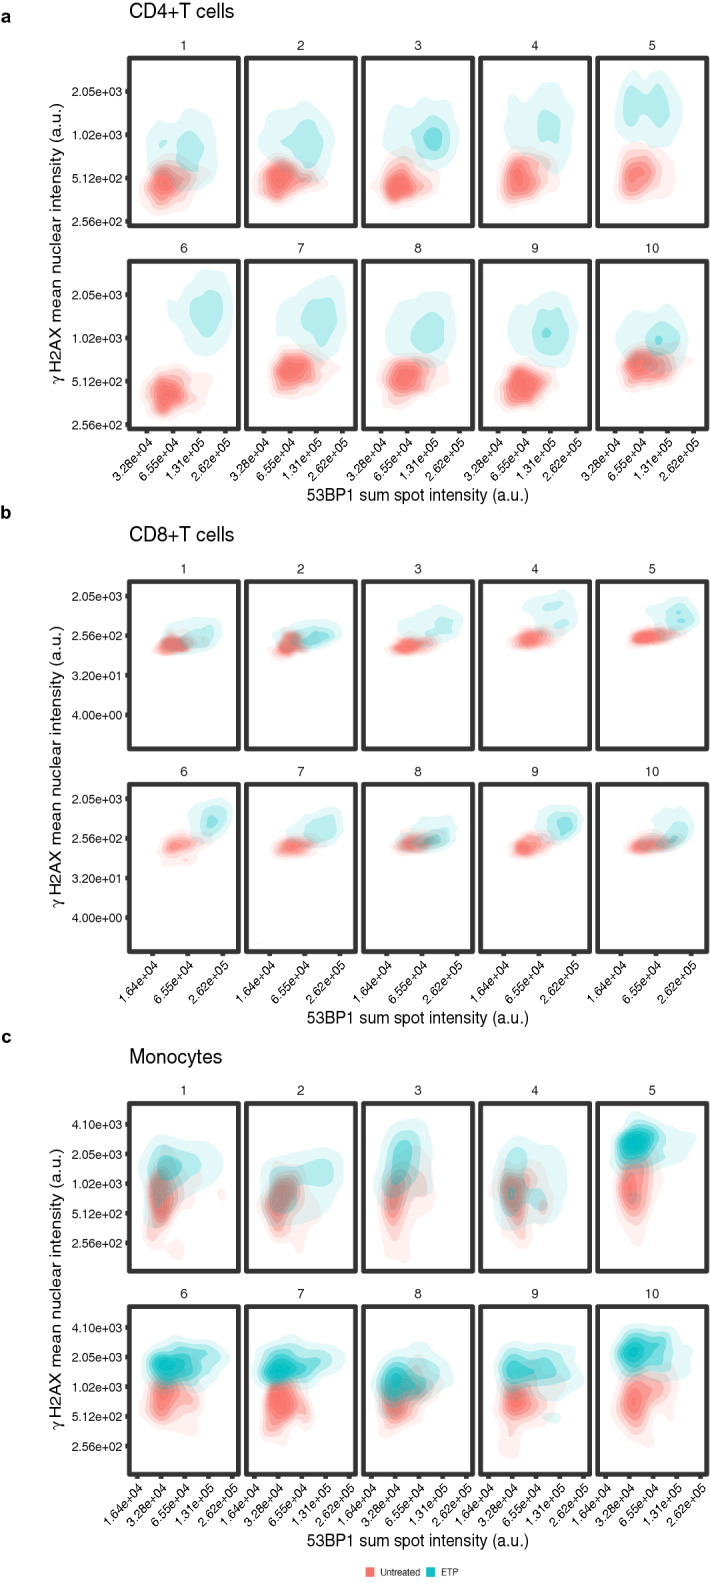
Figure 5.

Batch processing of human primary immune cells for analysis of 53BP1 spot intensity and γ-H2AX nuclear intensity. CD4 + T, CD8 + T, and monocytes of 10 different donors were processed simultaneously, left untreated or treated with 30 µM ETP for 1.5 h and imaged in high-throughput format. 53BP1 sum spot intensity vs. γ-H2AX mean nuclear intensity were blotted for each donor for (a) CD4 + T cells, (b) CD8 + T cells (c) monocytes. N = 663–5693 cells per sample.
