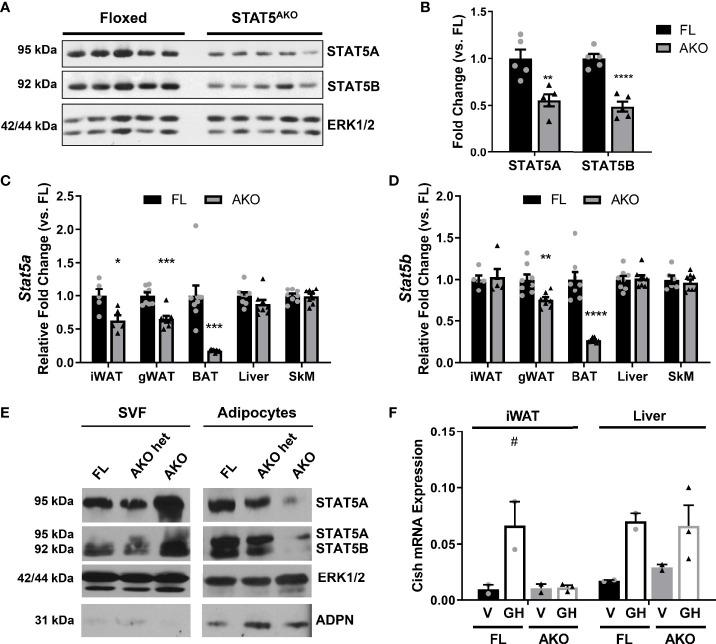
Figure 1.
Expression of STAT5A and 5B is knocked down in adipose tissue and adipocytes of STAT5AKO female mice. Female STAT5AKO (AKO) mice and their floxed (FL) littermate controls were euthanized at 3 (A–D), 4 (E), or 11 (F) months of age, and tissues were immediately collected for protein or gene expression analyses (A–D, F) or cellular fractionation (E). (A) Immunoblot of proteins resolved from iWAT samples for 5 mice of each genotype. (B) Quantification of band intensities from A (n = 5 per group). Band intensities were normalized to the loading control ERK1/2 and represented as fold change relative to FL mice. (C, D) Stat5a and Stat5b gene expression measured by RT-qPCR for the indicated tissues (n = 5 – 8 mice per group). (E) Gonadal white adipose tissue was removed from female STAT5AKO, heterozygous STAT5AKO (het AKO), and homozygous floxed control (FL) mice, fractionated into adipocytes and stromal vascular fraction (SVF), and 100 µg (SVF) or 200 µg (adipocyte) protein subjected to western blotting. Also shown are ERK1/2 as a loading control and adiponectin (ADPN) as an adipocyte marker. For each protein, the SVF and adipocyte samples were run on the same gel and the images were from the same exposure of the same blot. (F) Eleven-month-old female mice were injected with 1.5mg/kg mGH or vehicle (V; 0.1% BSA/PBS) for 30 minutes prior to euthanasia and tissue collection. Cish gene expression measured by RT-qPCR is shown (n = 2 – 3 mice per group). Significance was determined by t-test for FL versus AKO comparisons in A-D) and is denoted as *p < 0.05, **p < 0.01, ***p < 0.001, ****p < 0.0001. For F, a 2-way ANOVA was used to assess treatment/genotype and tissue variables with Tukey’s post-hoc multiple comparisons test to compare all treatment/genotype groups for each tissue; # denotes p < 0.05 for GH versus V comparisons. See also Figure S1 .

