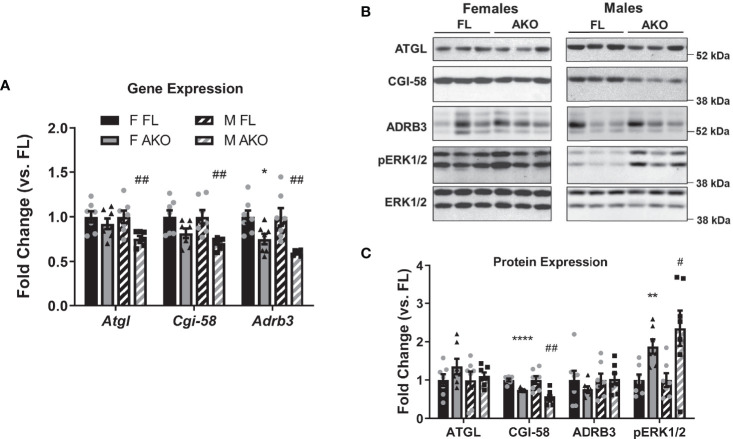
Figure 4.
Effects of loss of adipocyte STAT5 on expression of lipolytic proteins. Chow-fed female (F) and male (M) STAT5AKO (AKO) and floxed (FL) littermate control mice were euthanized at 11 weeks of age (non-fasted), and subcutaneous iWAT was collected for gene (A) and protein (B, C) expression analyses. (A) Gene expression of Atgl/Pnpla2, Cgi-58/Abhd5, and Adrb3 was measured by RT-qPCR and normalized against the reference gene Nono. (B) Protein expression was examined by immunoblotting, and three representative samples per group are shown. (C) Band intensities were quantified and normalized against total ERK1/2 expression. Fold change was calculated as the relative gene or protein expression values divided by the mean value of the floxed control group of the same sex for each gene/protein (n = 7 per group). Significance was determined by t-test for FL versus AKO comparisons and is denoted as *p < 0.05, **p < 0.01, or ****p < 0.0001 for female comparisons, while significance for male comparisons is denoted as #p < 0.05 or ##p < 0.01.

