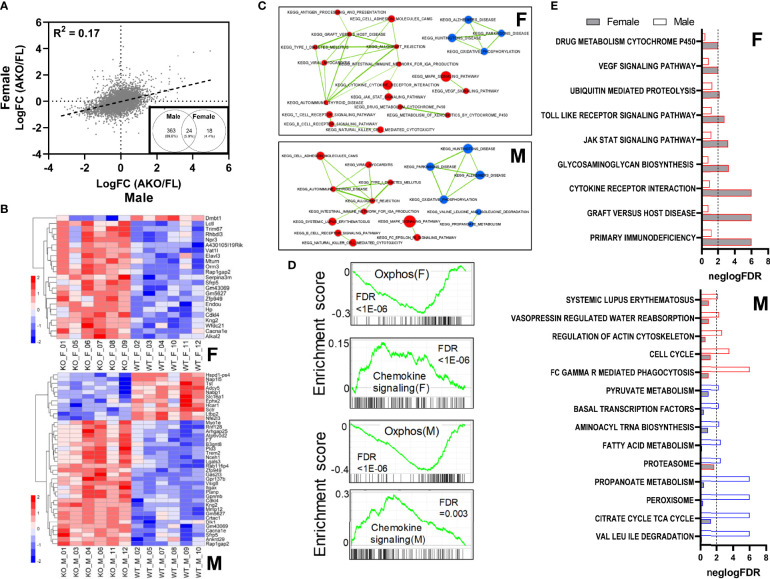
Figure 7.
Loss of adipocyte STAT5 results in sexually dimorphic gene expression changes within subcutaneous WAT. Inguinal WAT was collected from male and emale STAT5AKO and floxed (FL) control mice at 6 weeks of age, and isolated mRNA was subjected to RNA-sequencing analysis. (A) Scatterplot showing correlation between female and male gene expression changes resulting from adipocyte-specific loss of STAT5 (LogFC = Log fold change). The black dashed line is the trend line, and the correlation coefficient (R2) is shown. Inset: Venn diagram of 405 differentially regulated genes in male and female mice (AKO/FL) at threshold adjusted p-value equal to 0.05, expressed as numbers of genes and percentages of total regulated genes. (B) Heatmaps of expression levels of top differentially regulated genes in female (F) and male (M) samples. For females, genes with an adjusted p-value ≤ 0.1 and ≥ 2 or ≤ -2-fold differential gene expression, and for males, genes with adjusted p-value ≤ 0.01 and ≥ 2 or ≤ -2-fold differential gene expression are plotted. Heatmaps are row-normalized with lower gene expression shown in blue and higher gene expression in red. KO labels refer to STAT5AKO mice and WT to STAT5 floxed mice. (C) Enrichment maps of significant pathways identified from GSEA (FDR ≤ 0.05) that share gene members. Upper and lower panels show significant pathways in females and males, respectively. Pathways upregulated in knockouts are colored in red, and downregulated pathways in blue. Thickness of lines connecting pathways is proportional to the extent of gene sharing between them. Pathways with no shared genes are not shown. (D) Enrichment scores of selected pathways significantly altered in both females and males, as determined via GSEA. The upper panels for females (F) or males (M) show enrichment plots for the ‘oxidative phosphorylation’ pathway, which was downregulated in STAT5AKO mice of both sexes; bottom panel for each sex shows enrichment plot for the ‘chemokine signaling’ pathway which was upregulated in both males and females. Pathway enrichment p-values (FDR) are noted in each plot. (E) Pathways uniquely enriched in females (F) or males (M). For each pathway, the relative significance of enrichment (negative logarithm of the FDR) in females and males (gray and white bars, respectively) are plotted side by side, with the vertical dashed line representing an FDR of 0.01. Pathways upregulated in knockout samples are indicated by a red border and pathways downregulated in knockout samples are indicated by a blue border.

