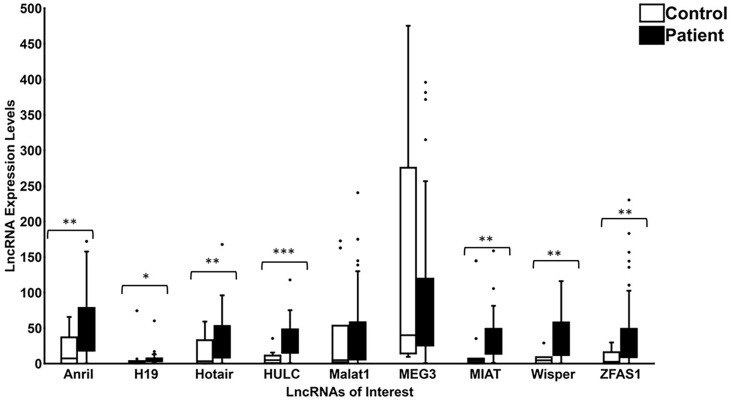
Figure 5.
Expression levels of lncRNAs in patients and controls. Boxplots represent comparison between expression level of 9 specific lncRNAs (ANRIL, H19, HOTAIR, HULC, MALAT1, MEG3, MIAT, WISPER and ZFAS1) detected by RT-qPCR in patient and control groups. The median and interquartile range (25th -75th percentile), are shown as solid horizontal lines. Two outliers from control samples I6 and A1 for MEG3 (86096.52 and 2022.94, respectively) were removed for better graphical representation of the results. Statistical significance was assessed using Mann-Whitney U test (*p<0.05, **p<0.005, or ***p<0.0005; N=11 for control patients and N= 59 for diabetic patients). Statistical significance was considered at p<0.05. Legend: Control = Non-diabetic patients without any diabetic retinopathy; Patient = Diabetic patients with or without diabetic retinopathy.

