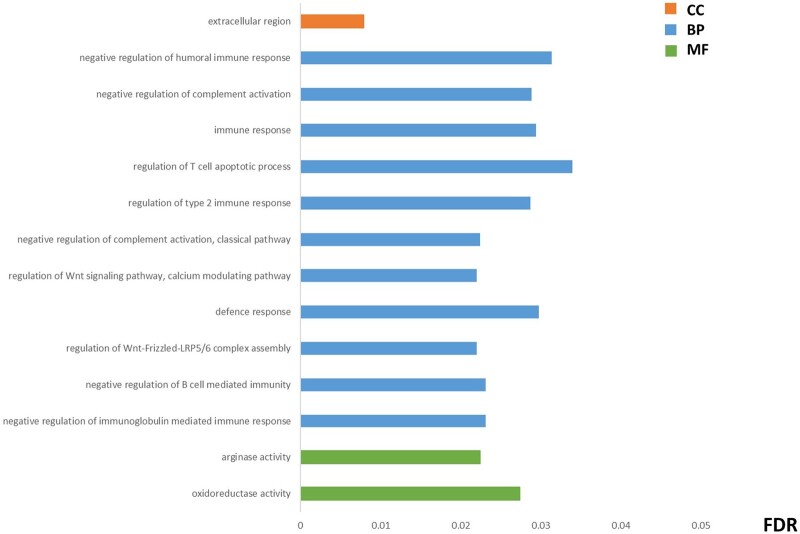
Figure 3.
Functional enrichment analysis of the endometrial receptivity genes within the meta-analysed transcripts. The most representative items detected were consistently dysregulated in the intersection between each endometrial receptivity test and the studies included in the meta-analysis (endometrial receptivity array (ERA) versus studies; ER Map®/ER Grade® test versus studies; and beREADY® test versus studies). Only the processes that have a significant false discovery rate (FDR) across the three comparisons are shown. The values of FDR in the figure correspond to the average value of the FDR for each comparison. Complete details of the results of the meta-analysis are described in Supplementary Table SV. BP, biological processes; CC, cellular components; MF, molecular functions.

