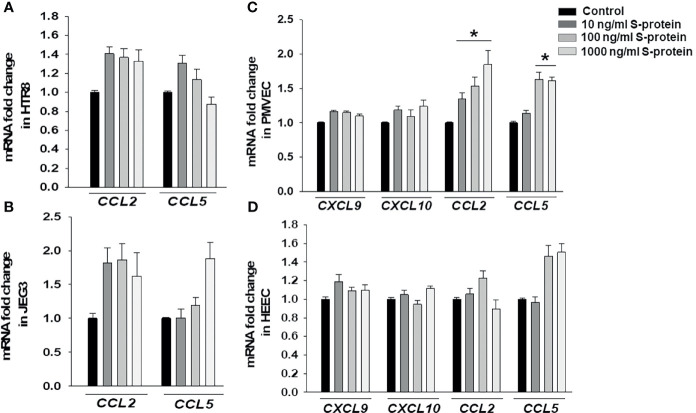
Figure 3.
Expression chemokines mRNA in trophoblastic and endothelial cells cultures treated by rh-S-protein. qPCR analysis revealed to measure of expression levels of CCL2, CCL5, CXCL9 and CXCL10 in HTR8/SVNeo (A), JEG3 (B), PMVEC (C) and HEEC (D) cultures treated with 10, 100, or 1000 ng/ml rh-S-protein vs. control. Bars represent mean ± SEM, n=4; * P<0.05 vs. control.

