Figure 7.
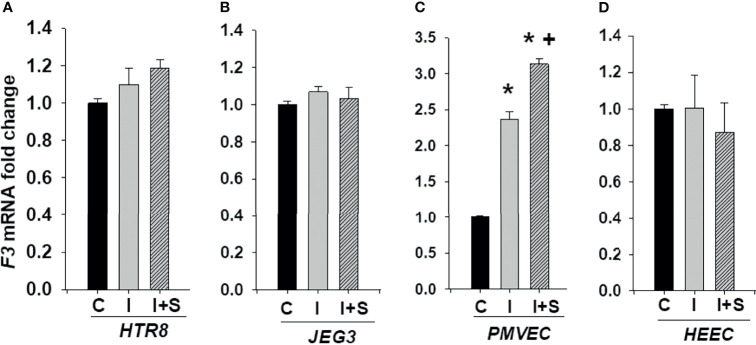
IFNγ with or without S-protein significantly increases tissue factor (F3) levels in only PMVECs. Expression of F3 was measured in HTR8/SVneo (A), JEG3 (B), PMVECs (C), and HEECs (D) treated with either control or 10 ng/ml rh-IFNγ alone or in combination with 10 ng/ml rh-S-protein. Bars represent mean ± SEM, n=4 * P<0.05 vs. control. + P<0.05 vs. rh-IFNγ alone. C, Control; I, rh-IFNγ; and I+S, rh-IFNγ + rh-S-protein.

