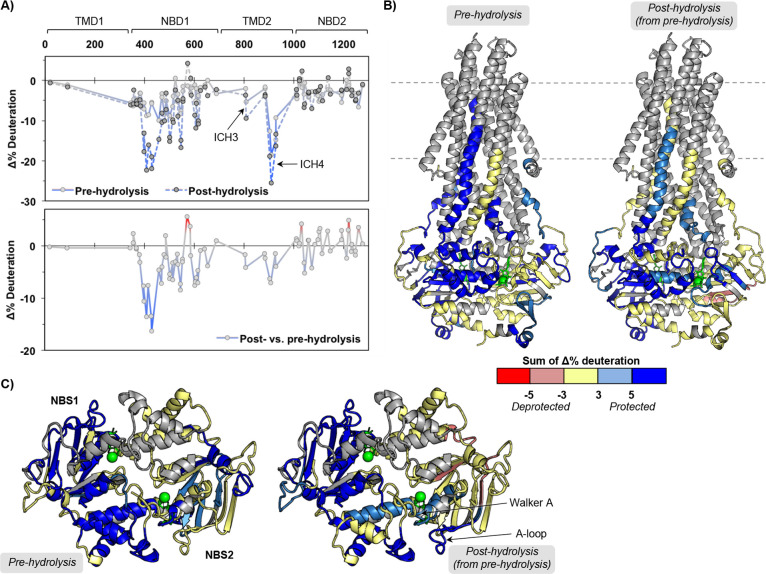
Figure 2.
Large dynamic changes in pre- and post-hydrolysis states define macro states of the P-gp catalytic cycle. (A) Sequence plots of the changes in HDX across time points for the pre-hydrolysis (AMPPNP) and post-hydrolysis (ATP/VO4) states relative to the nucleotide-free state (top) and changes between post- and pre-hydrolysis (bottom). (B) Peptides showing significant HDX changes plotted on the ATP-bound structure (PDB ID: 6C0V(16)). (C) Top-down view from membrane into cytoplasm of NBDs and ICHs. See Figures S6 and S7 for individual peptide plots and sequence plots for each time point.

