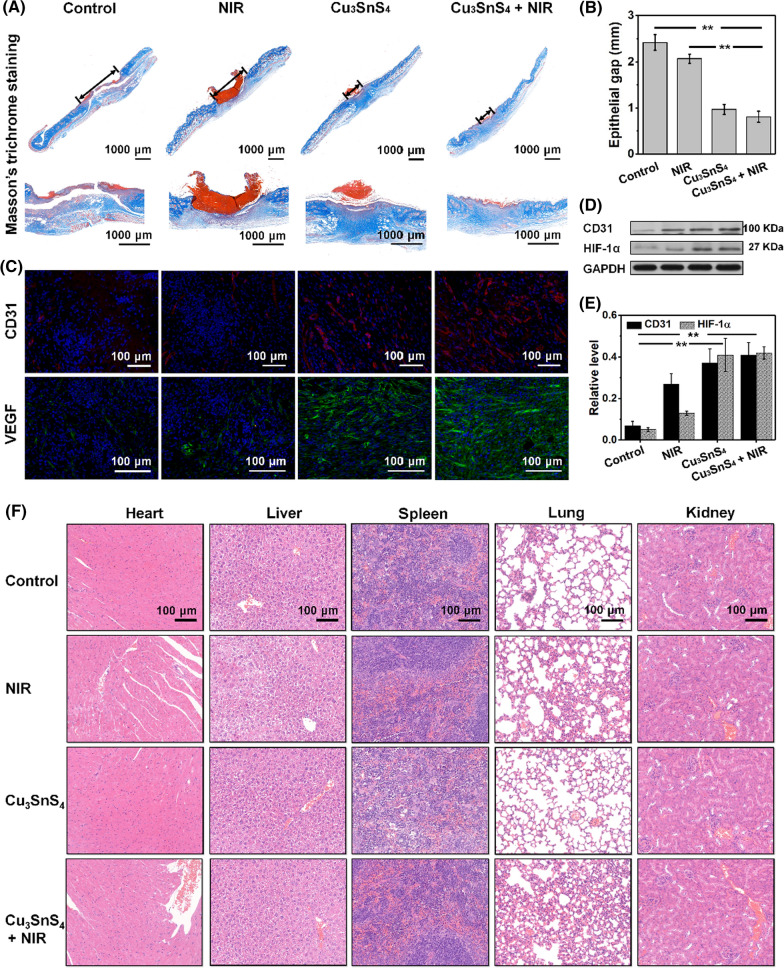
Fig. 7.
A Histopathological analysis of Masson’s trichrome staining of wounds in mice on day 8 after different treatments. B Corresponding epithelial gap in each group after the treatment. C Representative histological images of CD31 and VEGF immunofluorescence staining of wound tissue in each group at the end of the 8 days’ treatments. D Western blot analyses of CD31 and HIF-1α expressions in wound of mice in each group at the end of 8 days’ treatments. E Corresponding quantitative level of CD31 and HIF-1α expressions in each group. F Representative H&E staining images of major organs after different treatments

