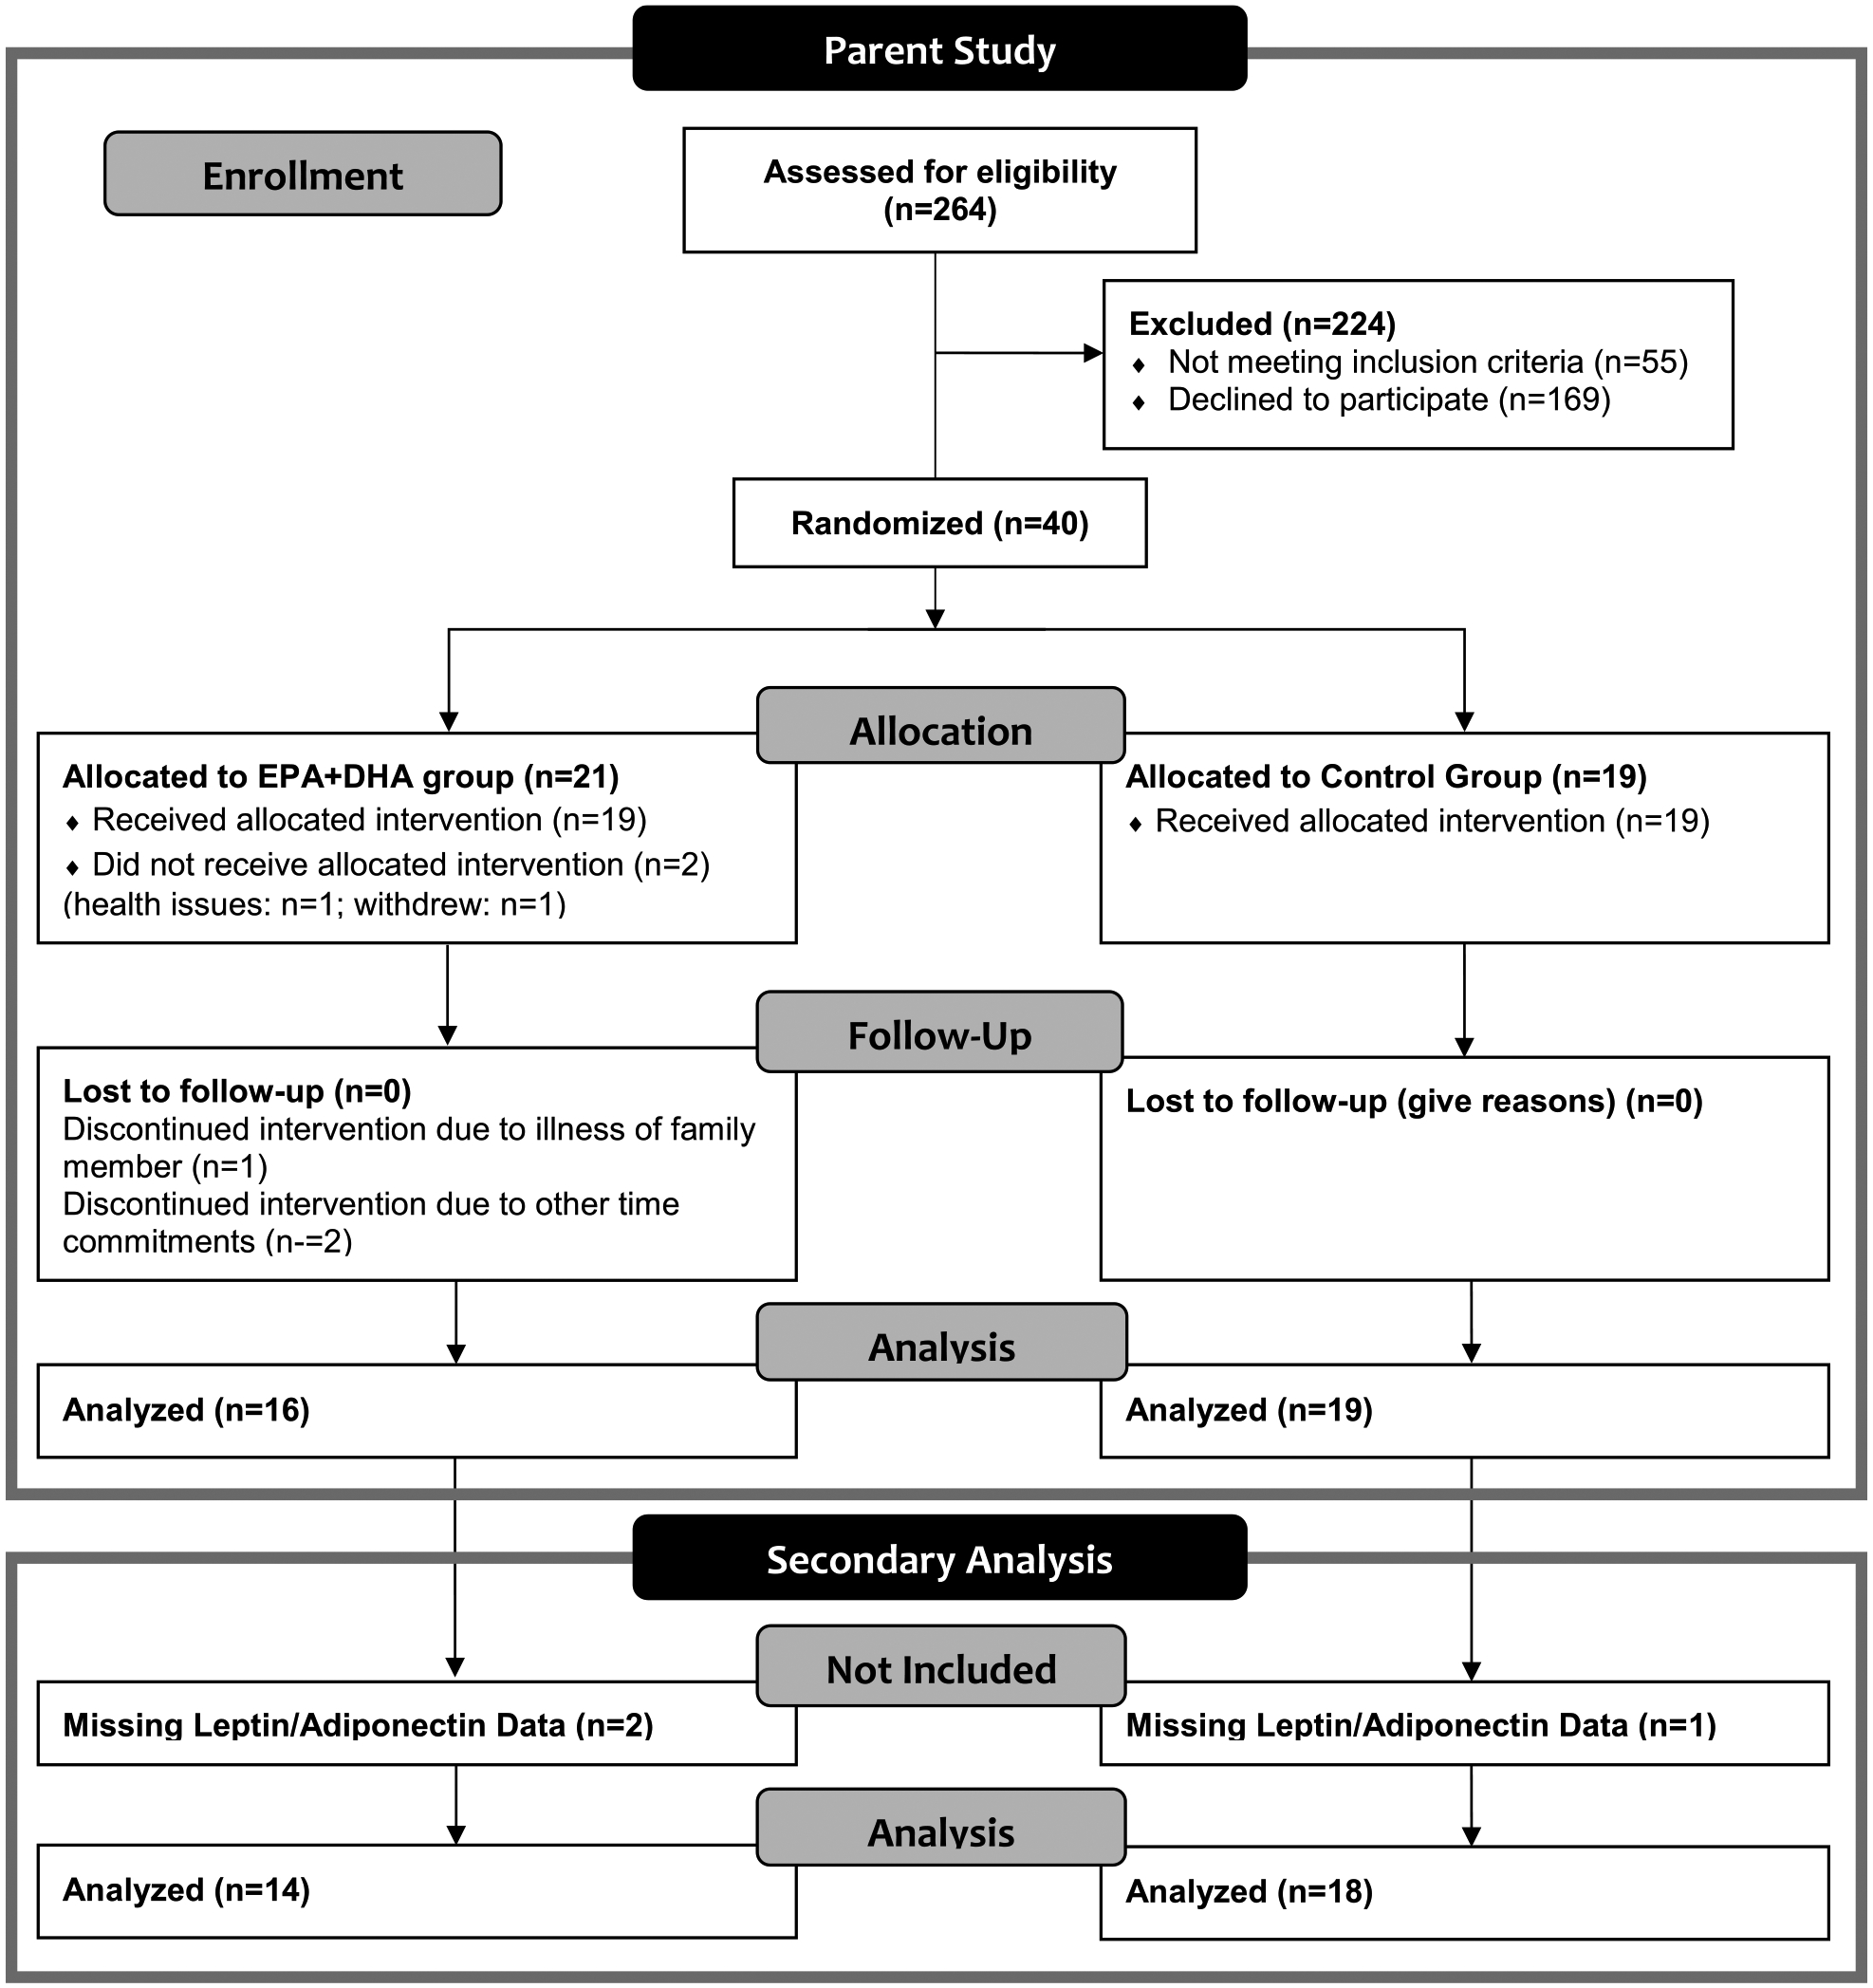
Fig. 3.

CONSORT diagram of participant flow through parent study and inclusion in secondary analysis. The CONSORT diagram depicts the flow of participants through the parent study from eligibility assessment through completion of the parent study and inclusion in secondary analysis. Of the 264 persons assessed for eligibility 40 participants met inclusion and exclusion criteria and were randomized into the two groups. Thirty-five of those 40 participants completed the entire parent study. Of the 35 participants that completed the parent study, only 32 had complete leptin and adiponectin data for all three study time points. As such, data from 32 participants were included in this secondary data analysis.
