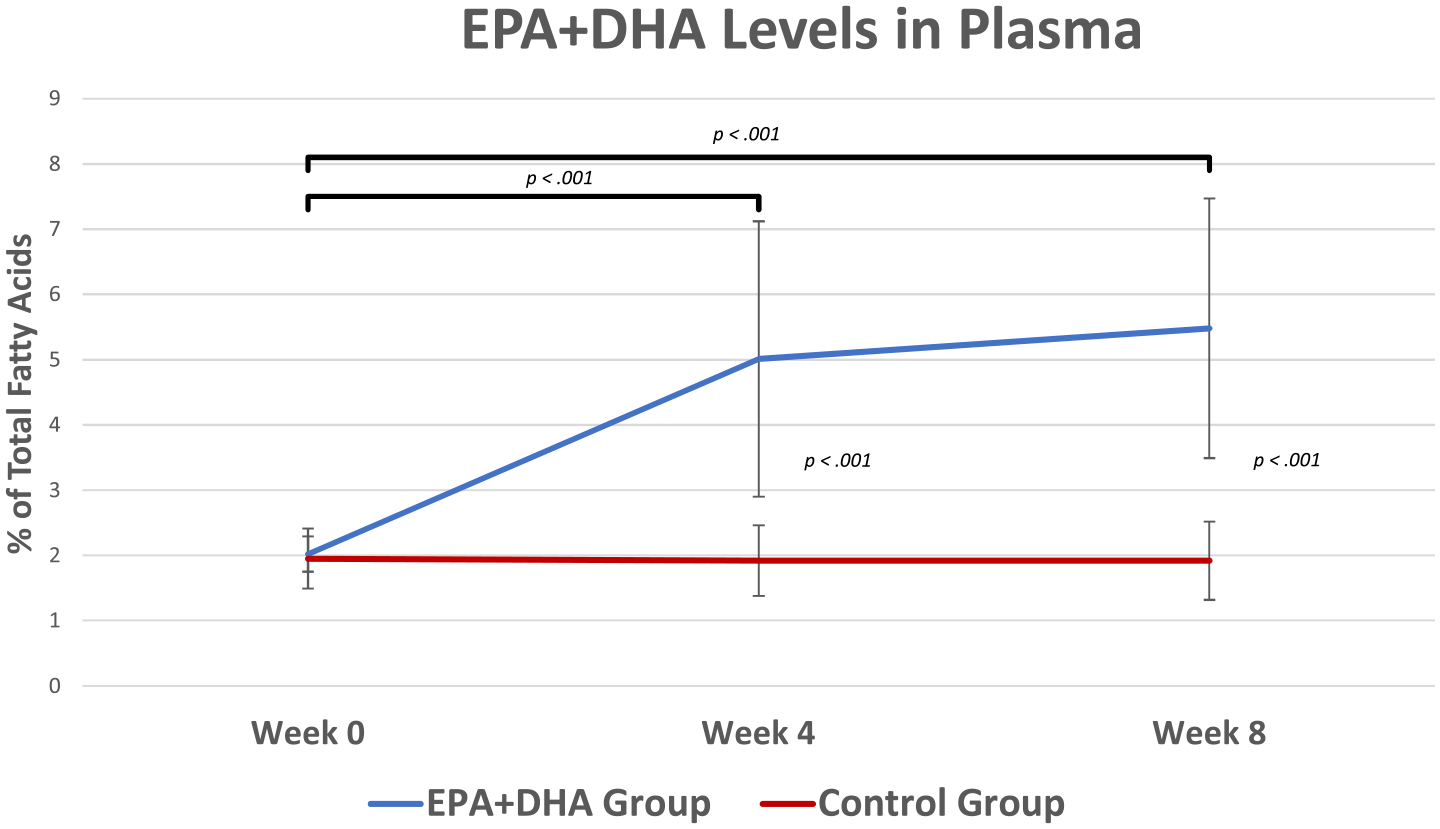
Fig. 4.

Plasma Levels of EPA+DHA by Treatment Groups at Study Time Points. At baseline, both groups had similar levels of plasma EPA+DHA (EPA+DHA group M = 2.02, SE = 0.18 and Control group M = 1.95, SE = 0.11, t(30) = 0.37, p = .71, d = 0.12). The EPA+DHA group had significantly higher plasma levels of EPA+DHA at week 4 (M = 5.01, SE = 0.56) and at week 8 (M = 5.48, SE = 0.53) compared to week 0 (M = 2.02, SE = 0.18), t(13) = −5.12, p < .001, t = −7.44, p < .001, respectively. alternatively, the Control group did not show significant changes in plasma levels of EPA+DHA across time (week 0: M = 1.95, SE = 0.11; Week 4: M = 1.92, SE = 0.13; week 8: M = 1.92, SE = 0.14), t(17) = 0.438, p = .67, t(17) = 0.437, p = .67, respectively. The between-group analysis showed that the plasma levels of EPA+DHA were significantly higher in the EPA+DHA group at week 4 (M = 5.01, SE = 0.56) and at week 8 (M = 5.48, SE = 0.53) compared to the Control group (week 4: M = 1.92, SE = 0.13; week 8: M = 1.92, SE = 0.14), t(30) = 5.997, d = 2.01, p < .001, t(30) = 7.218, p < .001, d = 2.42, respectively. This indicates that both groups adhered to the study protocol and that the treatment dose was adequate to significantly change plasma levels of EPA+DHA. EPA = eicosapentaenoic acid; DHA = docosahexaenoic acid. Error bars represent ±SEs. Between group analyses revealed significant differences at Week 4 and Week 8, p < 0.001, < 0.001, respectively.
