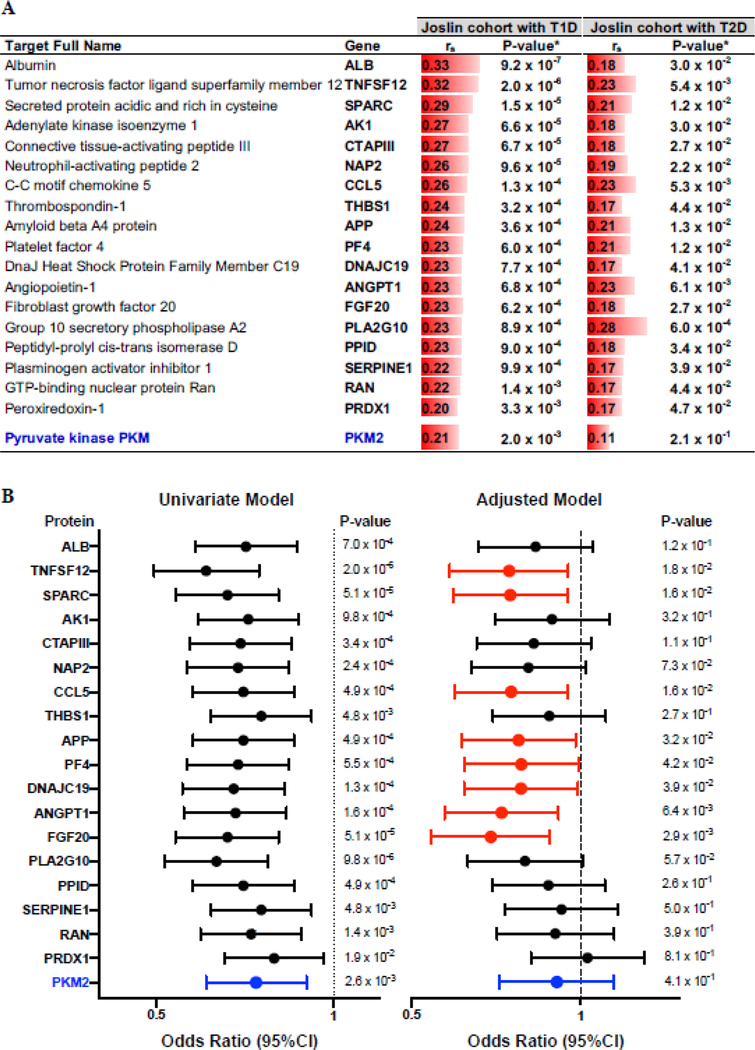
Fig. 3. Candidate circulating proteins associated with protection against progressive renal decline.
(A) Spearman’s rank correlation coefficients (rS) between baseline concentration of 19 plasma proteins and eGFR slope in the Joslin cohorts with T1D (N = 214) and T2D (N = 144). Red bars are a graphic representation of the effect size. Corresponding two-sided P-values have been provided. *Thresholds for the significance used: FDR adjusted P < 0.005 in the T1D exploratory cohort and a nominal P < 0.05 in the T2D replication cohort. (B) Odds ratios (95% CI) for the 19 candidate protective proteins and progressive renal decline (eGFR loss ≥ 3.0 ml/min/year) in the combined cohorts with T1D and T2D in univariate and adjusted logistic regression models. The effect is shown as an odds ratio (95% CI) per one quartile increase in circulating baseline concentration of the specific protein. The final model was adjusted for baseline eGFR, HbA1c and ACR with stratification by type of diabetes. The 8 selected markers are in red. PKM2, included in the analysis based on previous publication, is in blue.

