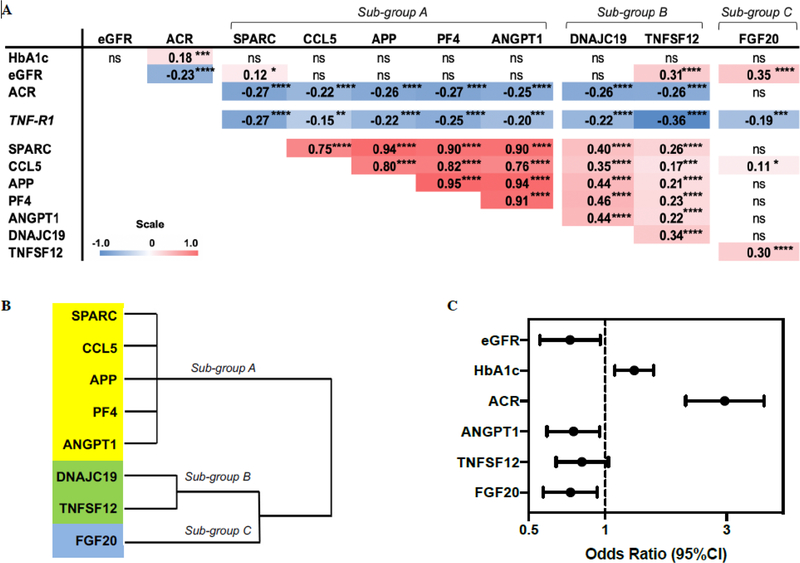
Fig. 4. Association of 8 confirmed protective proteins with clinical covariates and with risk of progressive renal decline.
(A) Spearman’s rank correlation matrix among 8 candidate protective proteins with TNF-R1 and important clinical covariates in the two cohorts adjusted for type of diabetes. Correlation coefficients (rs) are presented as shades of red (positive) and blue (negative) which correspond to the magnitude of the effect size. (B) Hierarchical cluster analysis in the combined Joslin cohorts. (C) Odds ratios (95% CI) of covariates selected from a backward selection of covariates using the significance criterion α = 0.1. The effects of eGFR and HbA1c on progressive renal decline are estimated per 10 ml/min/1.73m2 increase and per 1% increase, respectively. The effect of ACR on progressive renal decline is estimated as one unit increase of log10 ACR. The effect of each protein is shown as an odds ratio (95% CI) per one quartile increase in circulating baseline concentration of the relevant protein. *P<0.05; **P<0.01; ***P<0.001; ****P<0.0001; ns, not significant.

