Figure 2.
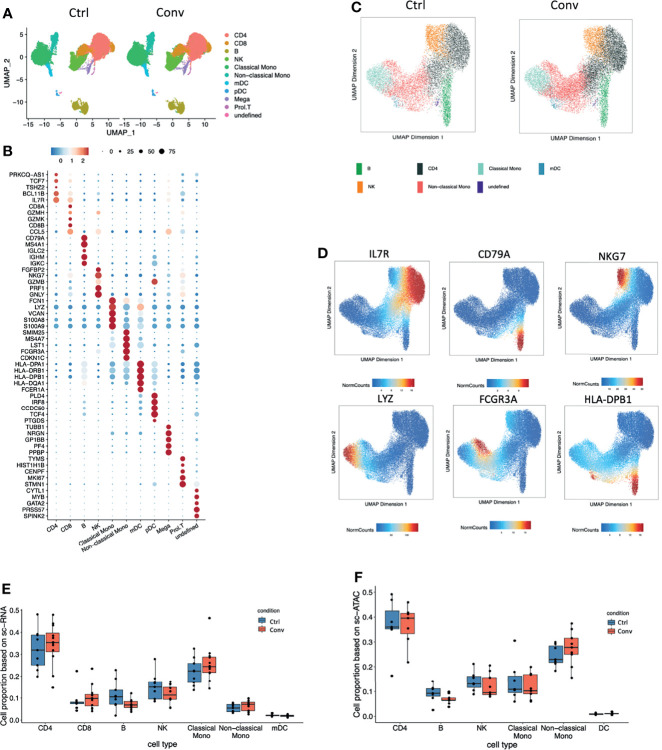
Single-cell transcriptome and epigenome analysis defined major immune cell subsets in convalescent COVID-19 individuals. (A) A total of 41486 and 25266 single-cell transcriptomes from COVID-19 convalescent and control samples were obtained respectively. Using the uniform manifold approximation and projection (UMAP) method, we captured 11 major cell types based on the canonical markers in the dot plots (B). (B) Dot plot showing the expression level of the marker genes in each cell type. Dot size reflects the proportion of cells expressing the indicated gene; the color encodes the average expression level (low=blue, high=red). (C) A total of 21102 and 17084 nuclei from 9 COVID-19 convalescent and 7 control samples were obtained respectively. Seven major cell types were captured based on the canonical markers shown in the feature plot(D). (D) The UMAP showing the labelled gene score for each cell. Blue represents the minimum gene score while red represents the maximum gene score for the given gene. The minimum and maximum scores are shown in the bottom of each panel. The gene of interest are shown in the upper of each panel. Cell proportions from (E) single-cell RNA sequencing and (F) single-cell ATAC dataset between convalescent COVID-19 and controls in the seven main cell types, CD4+ T cells, CD8+ T cells, B cells, NK cells, classical monocytes, non-classical monocytes, and mDCs.

