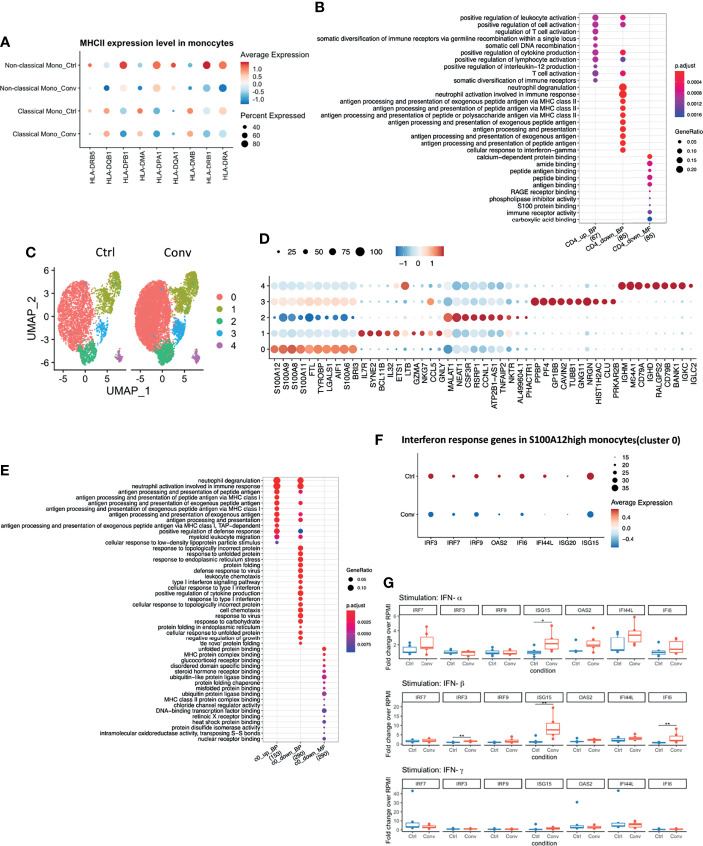
Figure 3.
Antigen processing and presentation via MHC II were downregulated in convalescent COVID-19 individuals, while baseline expressions of Interferon-Stimulated Genes (ISGs) in PBMCs are comparable to uninfected individuals. (A) Dot plot showing the MHC II expression levels across different conditions. The size of the dot depicts the percentage of cells within classical monocytes or non-classical monocytes; the color encodes the average expression level (low=blue, high=red). (B) Dot plot showing the GO enrichment analysis of DEGs in CD4+ T cells. The color and size of the dot indicate the significance (adjusted P-value) and the percentage of DEGs in the given GO term, respectively (BP, biological process, MF, molecular function). Top 10 enriched categories were shown. (C) UMAP of single-cell RNA sequencing data in classical monocytes in convalescent COVID-19 (n = 11) and control (n=9) samples. 5 cell clusters were identified. (D) Dot plot showing the top 10 markers for each cell cluster using the Wilcoxon Rank Sum test. The 0-4 in the y-axis means the cell clusters from(C). The color and size of the dot indicate the gene expression level (low=blue, high=red) and percentage of cells which expressing these markers. (E) Dot plot showing the GO enrichment categories of the DEGs found in each cluster. (F) Dot plot showing the interferon response genes expression levels across different conditions. The size of the dot depicts the percentage of cells expressing the indicated genes within cluster0; the color encodes the average expression level (low=blue, high=red). (G) Box plots showing the gene expressions of the seven interferon-stimulated genes (IRF7, IRF9, IRF3, ISG15, OAS2, IFI44L, and IFI6) 24 hours after stimulation with recombinant human IFN-α, IFN-β, and IFN-γ. Fold changes over RPMI (unstimulated condition) were reported. Mann-Whitney test was used to analyze the differences between controls and convalescent patients (n = 6, *P value < 0.05, **P value < 0.001).

