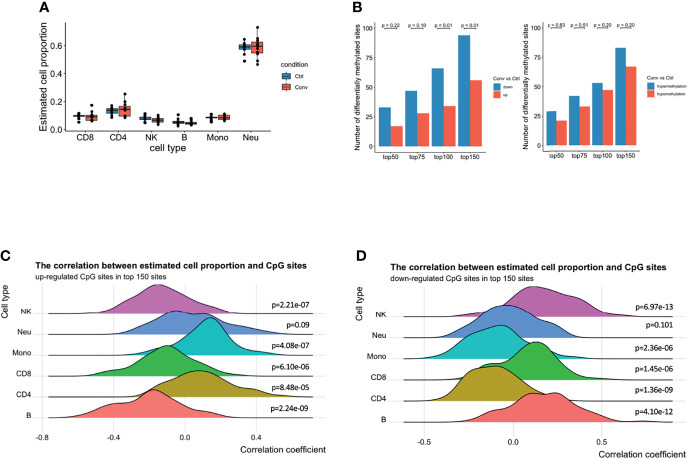
Figure 4.
A predominance of down-regulated methylation sites was observed in convalescent COVID-19 patients, mainly originating from monocytes and CD4+ T cells. (A) Box plot showing the estimated cell proportions in convalescent COVID-19 (n = 11) and control (n = 9) samples based on the methylation. No significant difference was observed in estimated cell proportions between the two conditions. (B) The number of up-/down-regulated and hyper/hypomethylated CpG sites in top 150 differentials methylated CpG sites ordered by raw P value from the linear regression model. A preponderance of hypermethylated sites and down-regulated methylation value was consistently observed at various thresholds compared with those in healthy controls. Fisher’s exact test was used for the statistical analysis. (C) The density ridgeline plots showing the correction between the estimated cell proportions and the up-regulated CpG sites in the top 150 differentially methylated CpG sites. (D) The density ridgeline plots showing the correction between the estimated cell proportions and the down-regulated CpG sites in the top 150 differentially methylated CpG sites. One side Wilcoxon test was used to calculate the significance of the correlation.

