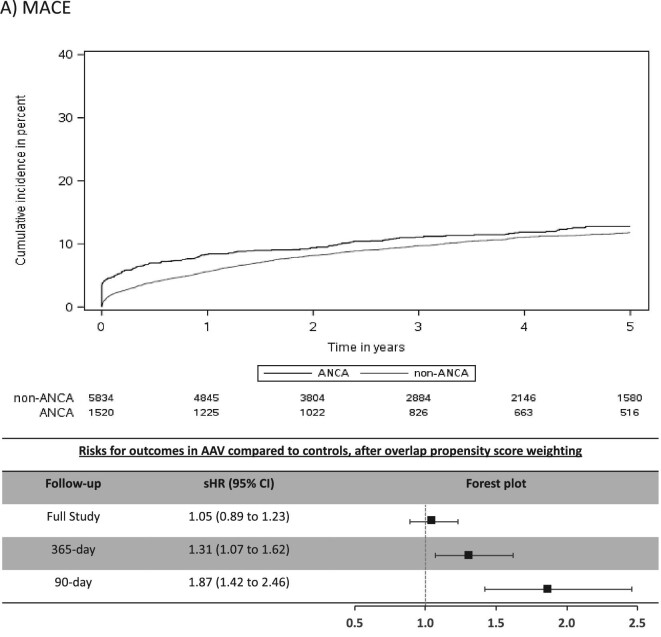
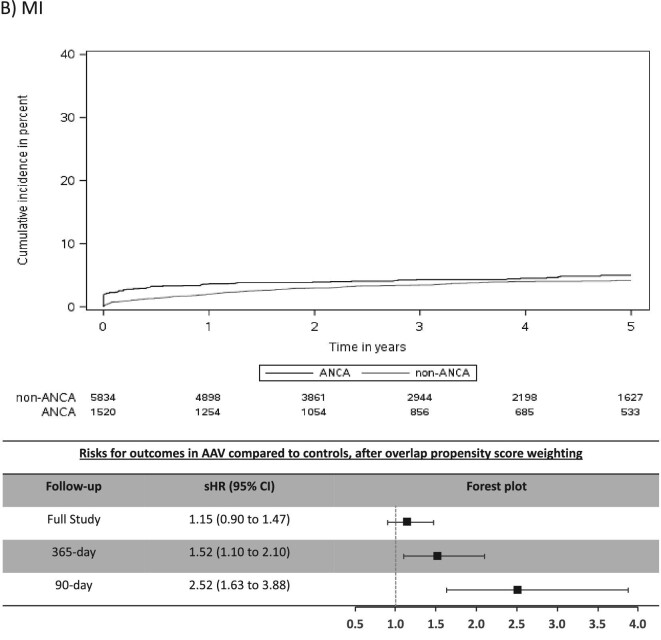
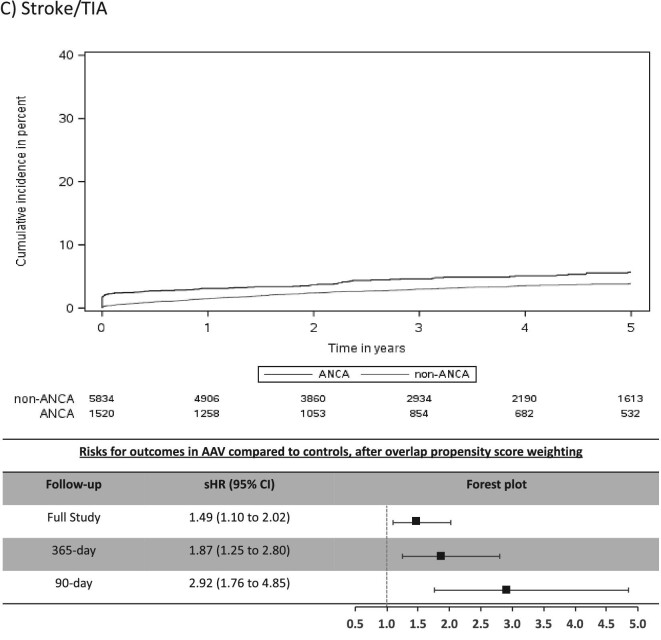
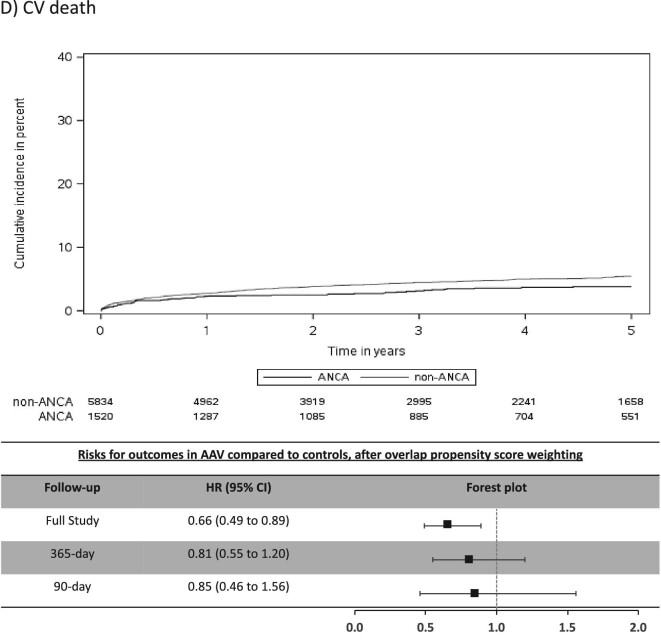
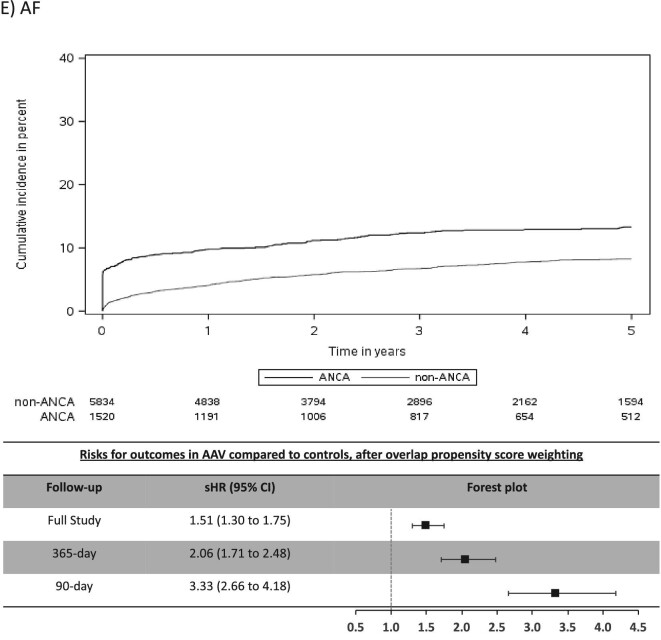
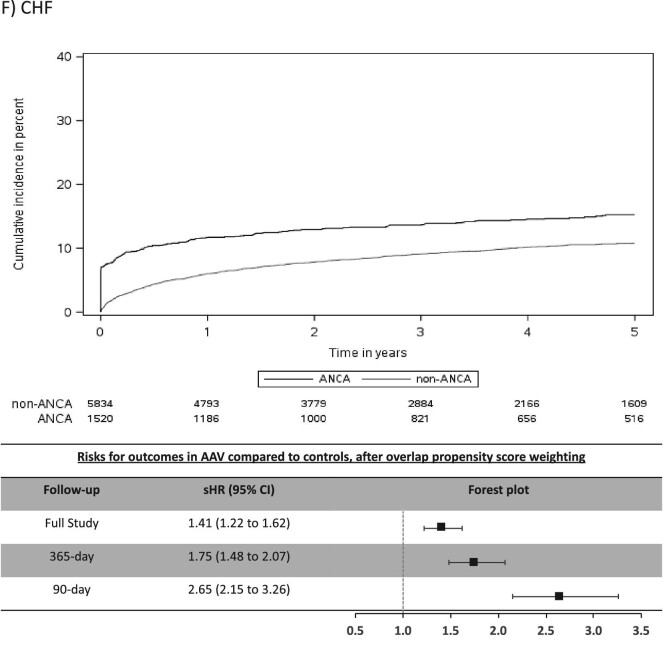
FIGURE 2:
Cumulative incidence function curves and forest plots with adjusted risks for outcomes. Cumulative incidence curves for each CV outcome by AAV status, along with forest plots of the sHR or outcomes in AAV group for 90-day, 365-day and full-study follow-up time. The sHR are adjusted for index year due to imbalances in this baseline characteristics between the two groups despite overlap propensity weighting. (A) MACE; (B) MI; (C) stroke/TIA; (D) CV death; (E) AF; (F) CHF.

