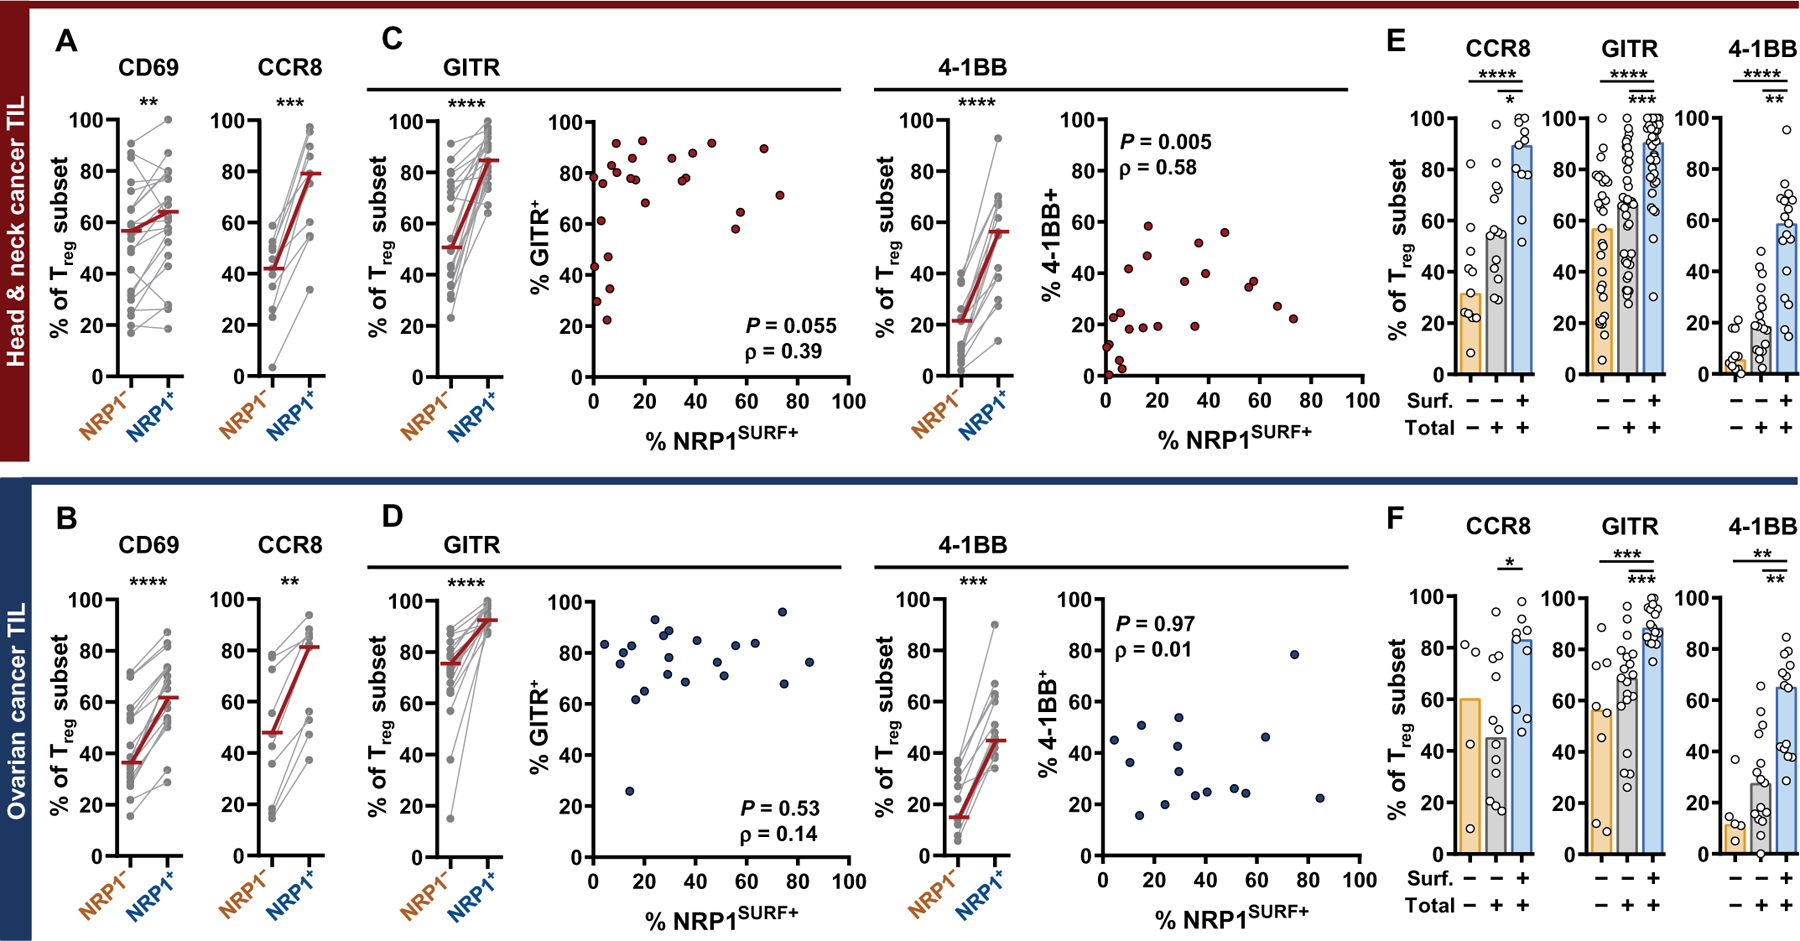
Fig. 2. NRP1 is coexpressed with numerous activation markers on intratumoral Tregs.

(A and B) NRP1SURF+ is indicated as NRP1+. Intratumoral NRP1+ Tregs are enriched for an activation phenotype as demonstrated by CD69 and CCR8 expression. Expression is reported as a percentage of respective Treg subpopulations. Median values are indicated by overlaid red bars. The number of samples is between 11 and 22 depending on the marker. Statistical comparison was done by paired, nonparametric t test (Wilcoxon). **P < 0.01, ***P < 0.001, and ****P < 0.0001. (C and D) Intratumoral NRP1+ Tregs consistently express high concentrations of TNF receptor superfamily (TNFRSF) members, GITR and 4–1BB. Median values are indicated by overlaid red bars. The number of samples is between 14 and 22 depending on the marker in the column graphs. Statistical comparison was done by paired, nonparametric t test (Wilcoxon). ***P < 0.001 and ****P < 0.0001. Overall nonparametric (Spearman’s) correlation of intratumoral surface NRP1+ Tregs with either GITR+ or 4–1BB+ as indicated is shown on the right side (the number of samples is between 15 and 25). (E and F) Quantification of Tregs that are completely NRP1 negative versus those that express the protein but do not have it on the cell surface (Total+, Surface−) or that express protein and have it on the cell surface (Total+, Surface+) is shown. The number of samples in each subgroup is between 4 and 34 depending on the marker and subgroup. Differences between the three subpopulations were assessed by nonparametric Kruskal-Wallis test with comparisons between all three groups controlled for with a 5% FDR. Bars indicate the median of expression. *q < 0.05, **q < 0.01, ***q < 0.001, and ****q < 0.0001.
