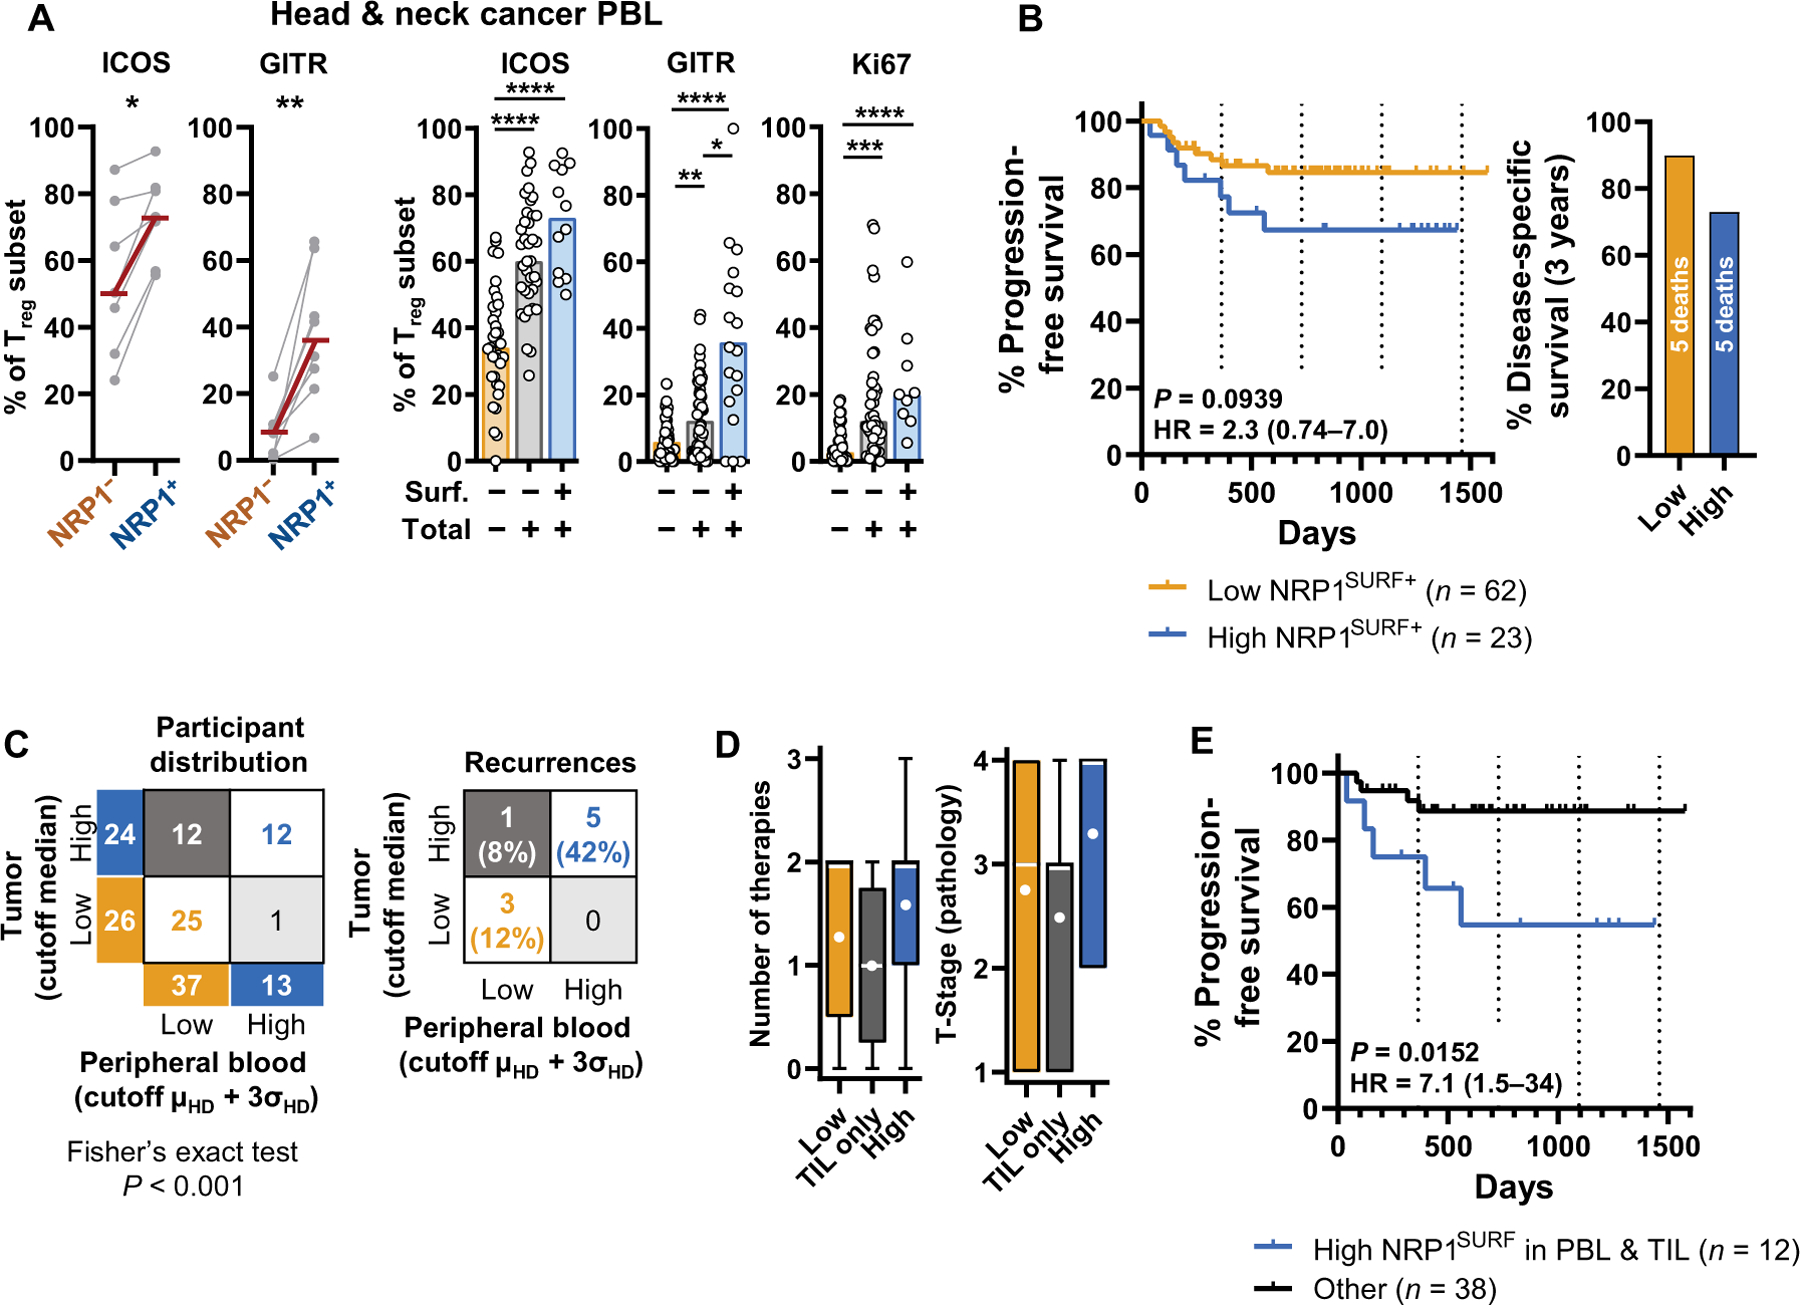
Fig. 5. Circulating NRP1SURF+ Tregs may serve as a prognostic indicator.

(A) Expression of ICOS, GITR, and Ki67 in peripheral blood NRP1SURF+ Tregs isolated from patients with HNSCC is shown. Paired nonparametric t test (Wilcoxon; n = 7 and 8, respectively) and nonparametric Kruskal-Wallis test (the number of samples ranges from 9 to 63 depending on the marker and subgroup) were used. Bars indicate the median of expression. *P < 0.05, **P < 0.01, ***P < 0.001, and ****P < 0.0001. (B) Kaplan-Meier curve for individuals grouped by Treg NRP1SURF in PBL as a predictor of PFS is shown. Curve comparison was conducted using the log-rank Mantel-Cox test. P value with the HR ± 95% CI is reported. Disease-specific survival for the same groups after 3 years of follow-up is shown on the right. (C) Concordance of assignment based on peripheral or intratumoral NRP1SURF expression is tabulated according to the groups previously described [HNSCC TIL cohort median for intratumoral Tregs; HD mean (μHD) plus 3 SDs (σHD) for PBL Tregs] and tested by Fisher’s exact test. Relative recurrence rates of corresponding groups are reported to the right. (D) Box plots show the number of lines of therapy (range 0 to 3) and pathology-defined T-stage; Tumor-stage (range, 1 to 4) for the three groups defined in (C): high NRP1SURF in both tumor and blood (blue; right), tumor alone (gray; middle), and low NRP1SURF (orange; left). These measures may correlate with disease burden. The white line indicates the median; the white dot indicates the mean. (E) A Kaplan-Meier curve for PFS is shown comparing high in both the TIL and PBL (blue) versus all other patients (black). Curve comparison was conducted using a log-rank Mantel-Cox test.
