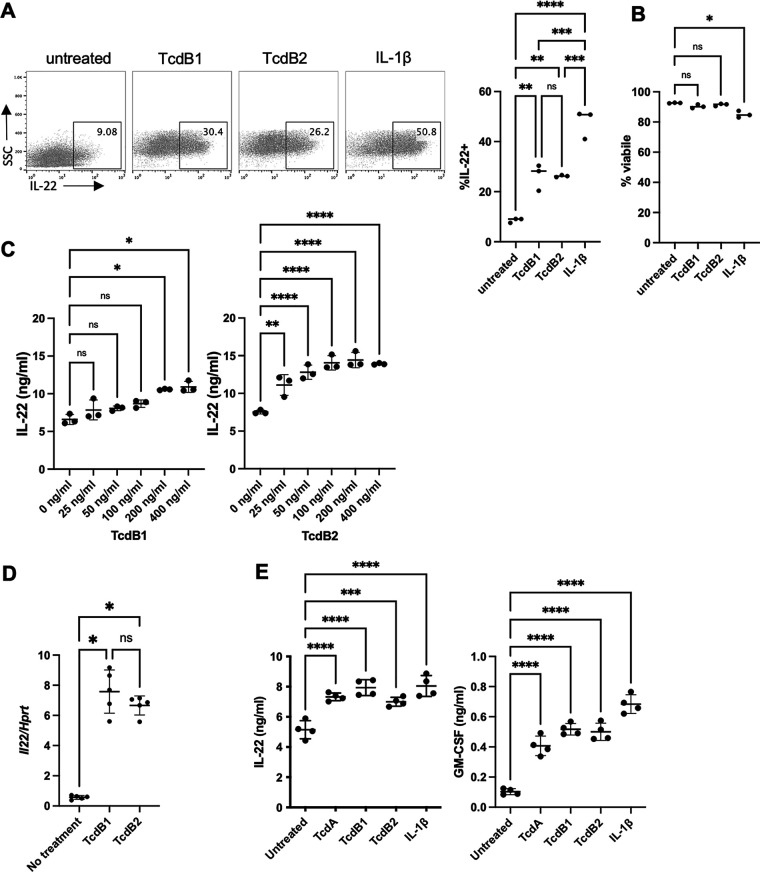
FIG 2.
Several C. difficile glucosyltransferase toxins induce ILC3 cytokines. (A and B) MNK-3 cells were treated with 200 ng/mL TcdB1, 200 ng/mL TcdB2, or 20 ng/mL IL-1β for 5 h in the presence of BFA and then analyzed by intracellular cytokine staining and FACS. Shown are representative FACS plots for viable MNK-3 cells with the percentage of IL-22+ cells (left) and summary data (right) and viability data (B), with each point representing a well. The line indicates the mean, n = 3. Data are from one experiment and represent three similar experiments. (C) MNK-3 cells were treated with the indicated concentration of TcdB1 (left) or TcdB2 (right) for 18 h, and then IL-22 was quantitated in the supernatants by ELISA. Each point represents a well. The line indicates the mean, n = 3. Data are from one experiment and represent three similar experiments. (D) MNK-3 cells were treated with 200 ng/mL TcdB1 or TcdB2 or left untreated for 4 h, and then Il22 was semiquantitated by real-time RT-PCR using Hprt levels for normalization. Each point represents one well. The horizontal line indicates the mean, n = 5. Experiment is representative of more than three independent experiments. (E) MNK-3 cells were treated with 200 ng/mL TcdA, 200 ng/mL TcdB1, 200 ng/mL TcdB2, or 20 ng/mL IL-1β or were left untreated for 18 h, and then IL-22 and GM-CSF were quantitated by ELISA in the supernatants. Each point represents one well. The horizontal line indicates the mean, n = 4. Experiment is representative of more than three independent experiments. *, P ≤ 0.05; **, P < 0.01; ***, P < 0.001; ****, P < 0.0001. Differences that were not significant (P > 0.05) are marked ns.

