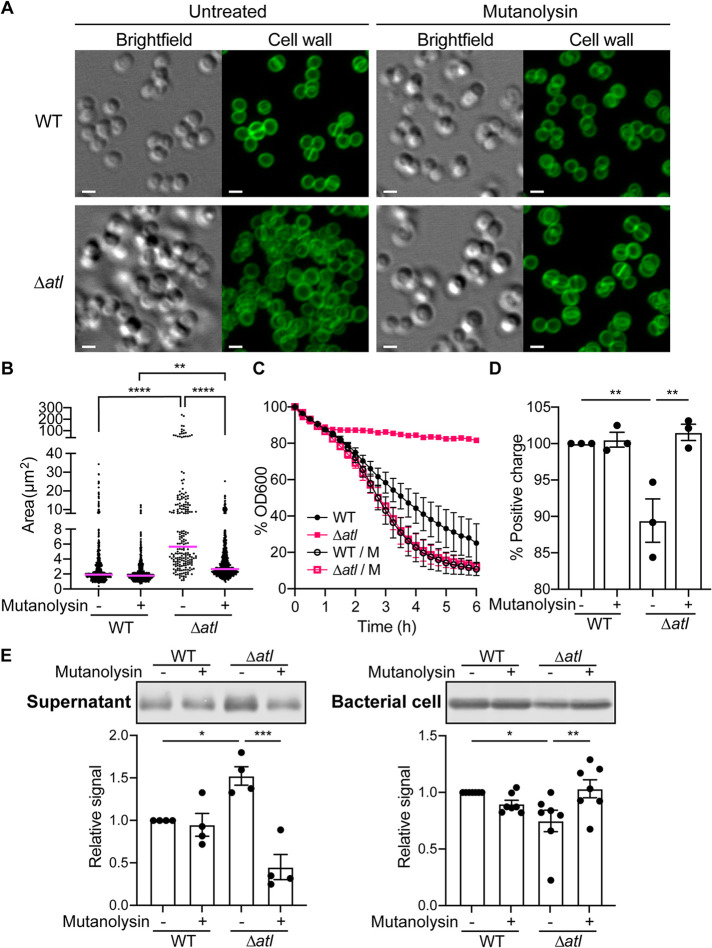
FIG 5.
Mutanolysin complements the phenotype of the atl mutant. (A) Light microscopy of WT and Δatl cells at the early stationary phase (4.5 h), treated with or without mutanolysin. The cell wall was stained with BODIPY FL vancomycin. Scale bar, 1 μm. (B) Area of the connected cells on a two-dimensional projection of WT and Δatl, treated with or without mutanolysin. Each dot is a cluster of cells. The line indicates the median. **, P ≤ 0.01; ****, P < 0.0001 by ordinary one-way ANOVA with Tukey’s multiple-comparison test. (C) Autolysis activity of WT and Δatl in 0.05% Triton X-100 in PBS, supplemented with or without mutanolysin. Data show mean ± SEM from 3 independent experiments. (D) Surface positive charge of WT and Δatl measured by cytochrome c binding to the cell surface. Data show mean ± SEM from 3 independent experiments. **, P ≤ 0.01 by RM one-way ANOVA with Tukey’s multiple-comparison test. (E) Representative immunoblots (top) and quantification (bottom) of LukA in the culture supernatant or bacterial cell lysate of WT and Δatl treated with or without mutanolysin. Bars show mean ± SEM from n = 4 (supernatant) or n = 7 (bacterial cell) independent experiments. *, P ≤ 0.05; **, P ≤ 0.01; ***, P ≤ 0.001 by RM one-way ANOVA with Tukey’s multiple-comparison test.

