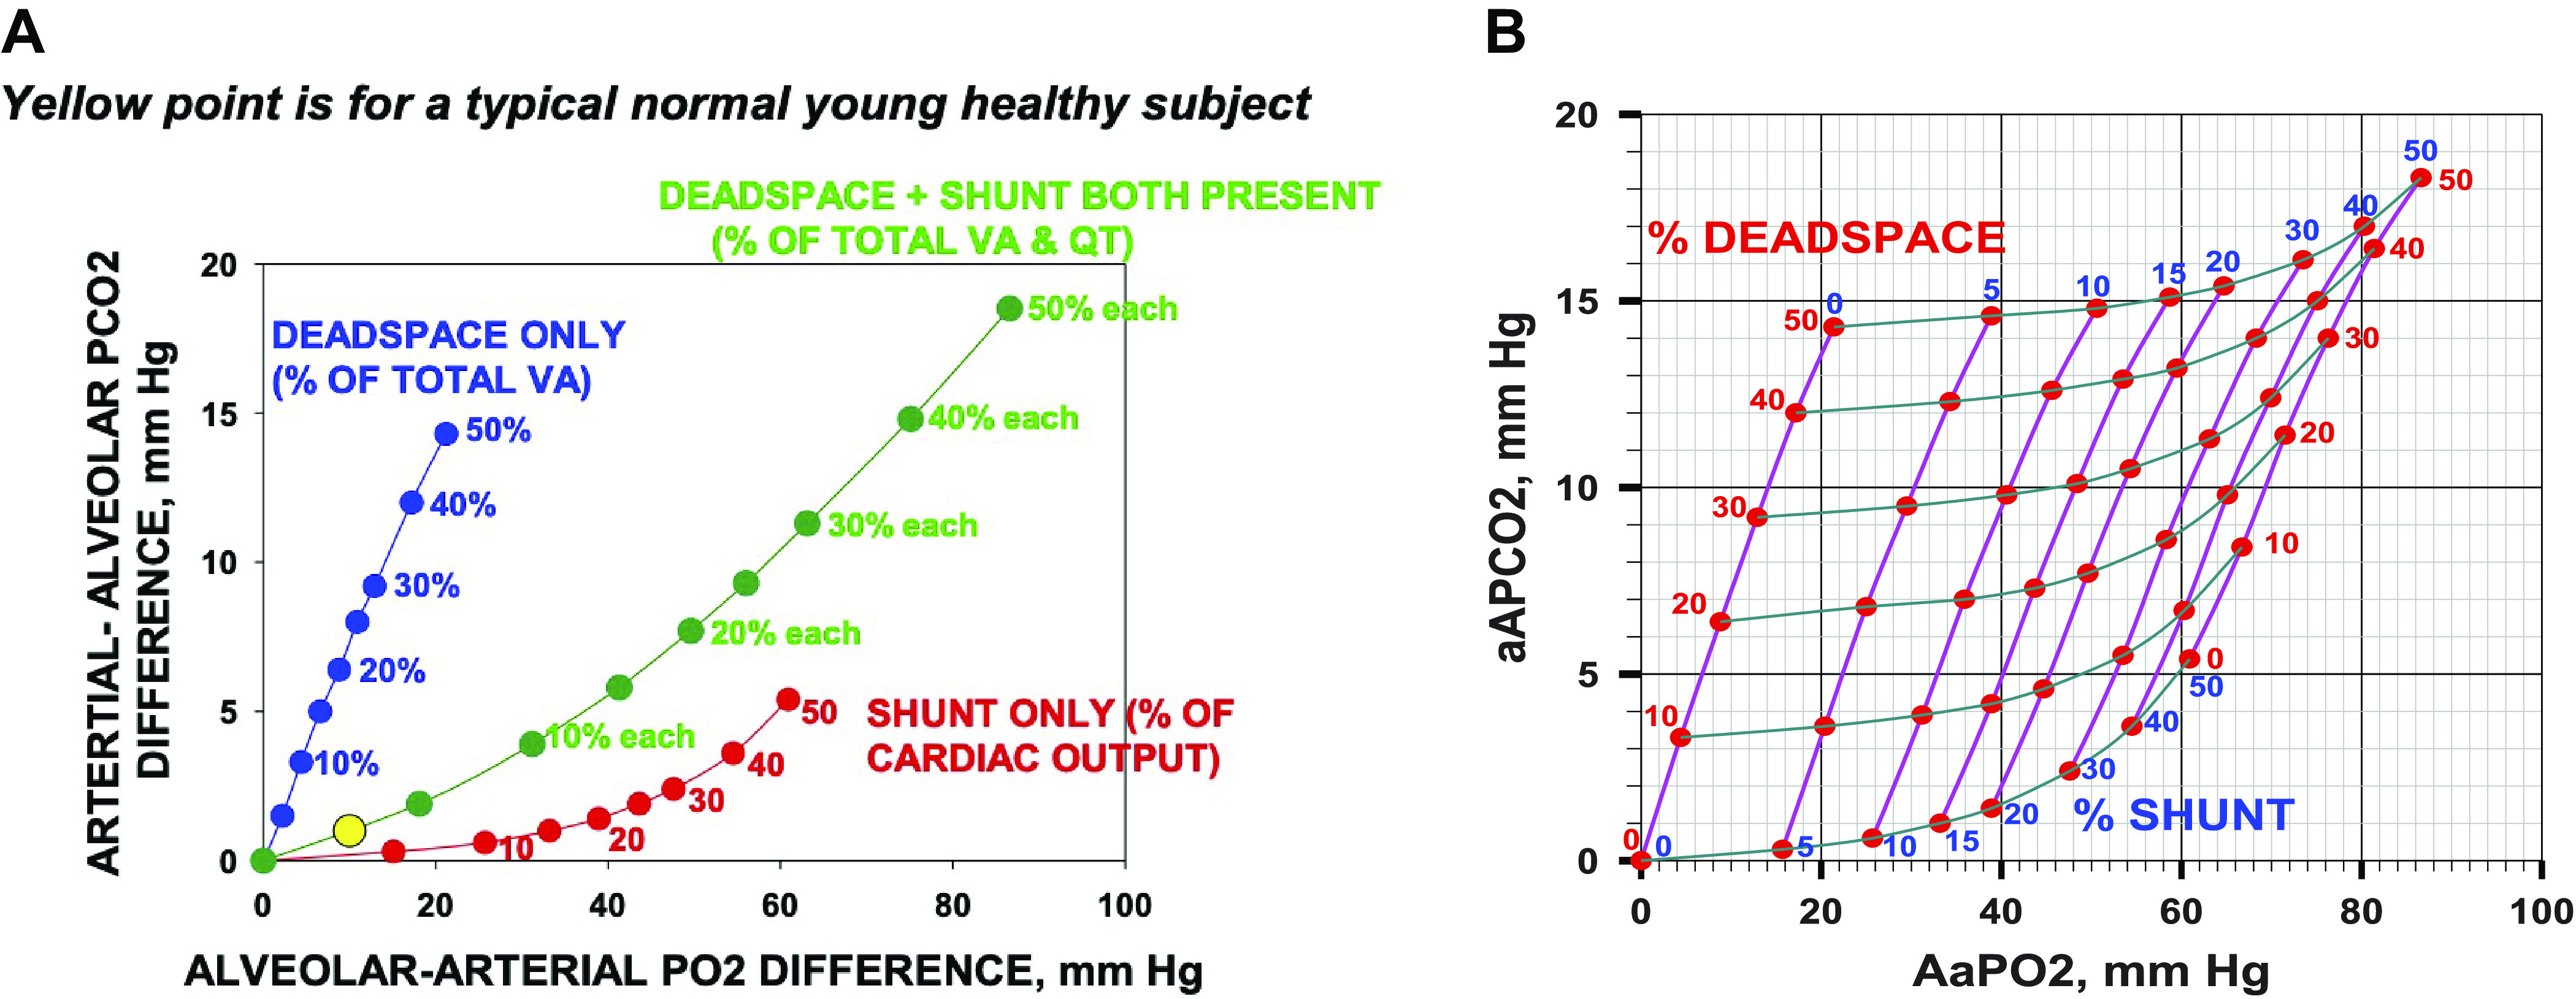
Figure 3.

A: the arterial-alveolar partial pressure differences for CO2 (ordinate) plotted against the alveolar-arterial partial pressure differences for O2 (abscissa). Red points: differences due to shunt alone (from 0% to 50% of the cardiac output); blue points: differences due to deadspace alone (from 0% to 50% of the ventilation); and green points: differences due to shunt plus deadspace (each from 0% to 50%). It is evident that although both O2 and CO2 are affected by shunt, by deadspace, and by their combination, the relationships between O2 and CO2 for each type of abnormality are very different. A normal young subject, with a typical alveolar-arterial Po2 difference of 10 mmHg and arterial-alveolar Pco2 difference of 1 mmHg is shown by the yellow solid circle. B: the plots of A extended into a complete grid showing alveolar arterial differences for O2 and CO2 as a function of the range of combinations of shunt and deadspace, each from 0% to 50%. This grid can be used for any measured pair of alveolar-arterial differences for O2 and CO2 to estimate the percentage of pulmonary blood flow perfusing unventilated regions (shunt) and percentage of alveolar ventilation associated with unperfused regions (deadspace). aAPco2, arterial-alveolar Pco2 difference; AaPo2, alveolar-arterial Po2 difference.
