
Figure 4.
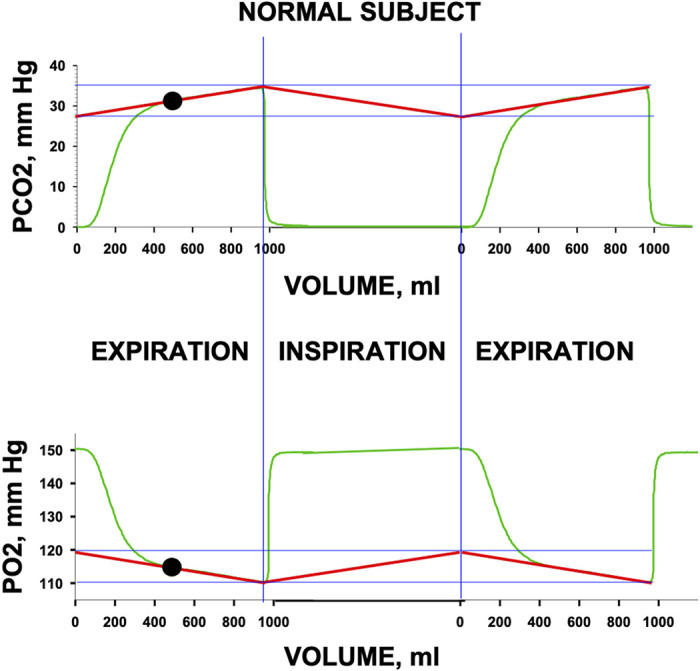
The figure shows an expiration (left), an inspiration (middle), and another expiration (right) for a normal subject (green tracings). For this conceptual example, the second expiration is a reproduction of the first. Tidal volume is a little less than 1,000 mL. Top panel shows Pco2 and bottom panel shows Po2. Vertical blue lines separate expirations from inspirations. The regression lines (red) for the alveolar plateau for each gas are linearly projected to the start of expiration and connected by the presumed linear return pathway for the inspiratory portion, highlighting the oscillation in alveolar gas levels between inspiration and expiration, marked by the horizontal blue lines drawn at the high and low points on the regression lines. The inspiratory segment shows inspired Po2 and Pco2. The expirations show initial exhalation of previously inspired conducting airway gas (first ∼100 mL), the transition toward alveolar gas (next ∼200 mL) and the linear, sloping, alveolar plateau (remainder of breath). The solid black circle indicates the mean alveolar Po2 and Pco2, which are the values at the midpoint of expiration.