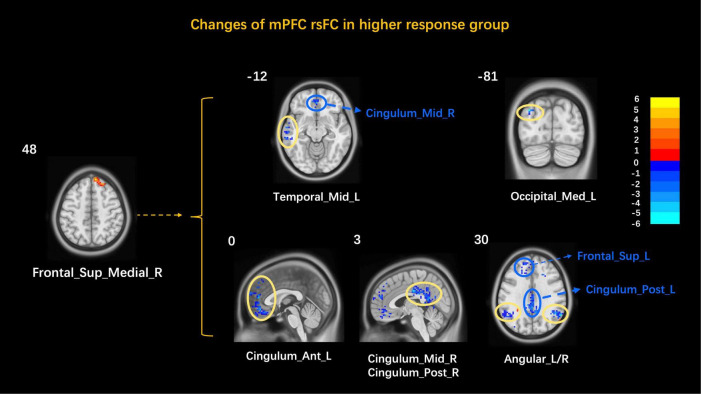
FIGURE 3.
Changes of the mPFC rsFC in the higher response group. Frontal_Sup_Medial, medial prefrontal cortex; Temporal_Mid, middle temporal gyrus; Cerebelum_Crus1, cerebellum superior; Cingulum_Ant, anterior cingulate cortex; Cingulum_Mid, middle cingulate cortex; Cingulum_Post, posterior cingulate cortex; L, left; R, right. Yellow circles mark peak points and blue marks non-peak areas.

