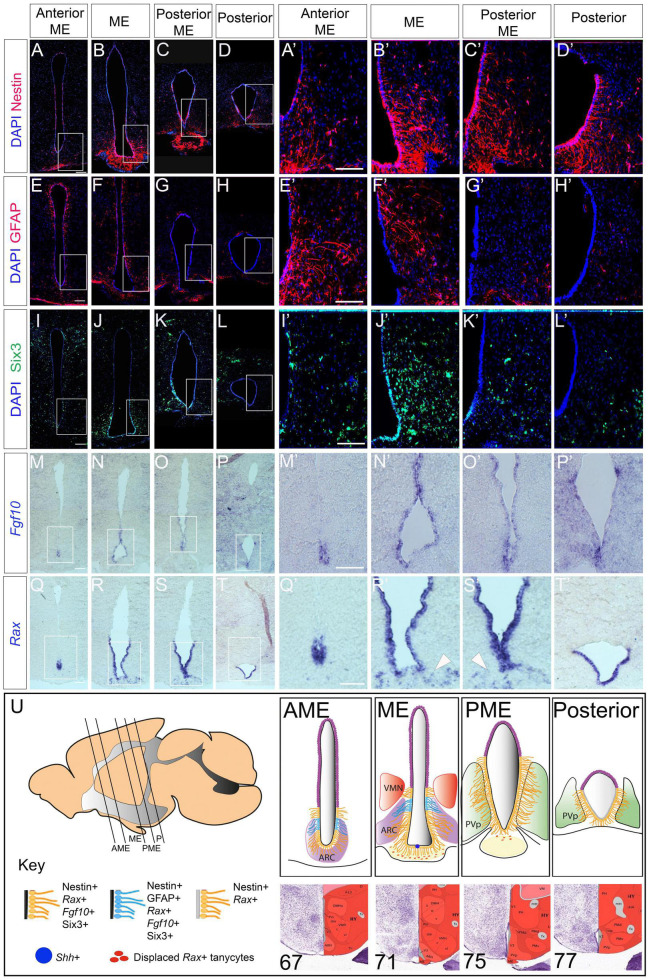
FIGURE 1.
Stem and progenitor marker distribution in the adult hypothalamus. (A–L′) Representative examples from consecutive coronal sections, from anterior to posterior, at the level of the AME, ME, PME and posterior tanycyte-rich hypothalamus; serial adjacent sections analyzed for expression of Nestin, GFAP and Six3. Boxed regions in panels (A–D,E–H,I–L) shown at high power in panels (A′–D′,E′–H′,I′–L′) (n = 5 mice; images from a single mouse). (M–T′) Representative examples from consecutive coronal sections across the AME, ME, PME and posterior tanycyte-rich hypothalamus; serial adjacent sections analyzed for expression of Fgf10 and Rax. Boxed regions in panels (M–P,Q–T) shown at high power in panels (M′–P′,Q′–T′). Arrowheads in panels (R′,S′) point to Rax-expressing displaced tanycytes (n = 3 mice; images from a single mouse). (U) Schematics showing tanycyte heterogeneity along the A-P axis. Sagittal schematic shows approximate section planes and positions of tanycytes in AME, ME, PME and posterior regions. Coronal schematics show extent of tanycytes of different character along the A-P axis. See key for details. Positions of the AME, ME, PME and posterior were judged relative to sections in the ABRA, based on morphology and position of key nuclei: specific numbered sections from the ABRA are shown below each schematic. Scale bar: 100 μm. ARC, arcuate nucleus; AME, anterior to median eminence; ME, median eminence, PME, posterior median eminence; P, posterior tanycyte-rich hypothalamus; PvP, periventricular nucleus, posterior part; VMN, ventromedial nucleus.

