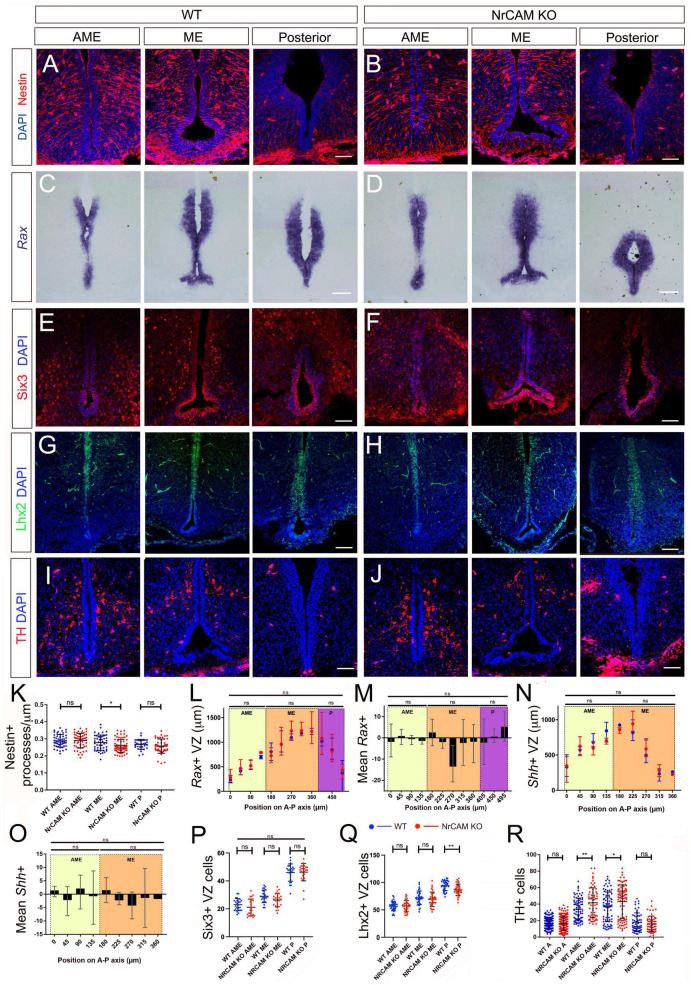
FIGURE 4.
Comparison of tanycytes and TH neurons in the embryo. (A–H) Representative serial coronal sections through AME, ME and posterior regions of the hypothalamus of E16 wild-type (A,C,E,G) or NrCAM KO mice (B,D,F,H) analyzed by immunohistochemistry to detect Nestin (A,B), Six3 (E,F), Lhx2 (G,H), or by chromogenic in situ hybridization to detect Rax (C,D) (n = 8 mice/genotype, analyzed for Nestin (n = 3), Six3 (n = 2), Lhx2 (n = 3) or Rax (n = 3). (I,J) Representative serial coronal sections through AME, ME and posterior regions of the hypothalamus of E18 wild-type (I) or NrCAM KO mice (J) analyzed by immunohistochemistry to detect TH (n = 3 mice/genotype). Scale bars: 100 μm. (K–R) Quantitative analyses in wild-type and NrCAM KO mice. (K) There is only a small reduction in Nestin-positive β1- and α2-tanycyte density in NrCAM KO mice across the ME region (p < 0.0200; unpaired t-test). Each icon represents a single measurement (n = 3 mice/genotype). Bars show SD. (L–P) There is no significant reduction in the lengths or relative intensities of Rax- and Shh-expressing domain (n = 3 mice/genotype), nor in the number of Six3 + VZ cells in wild-type (blue) and NrCAM KO (red) mice (n = 2 mice/genotype). Bars in panels (L,N) show mean and range; in panels (P–R) each icon represents a single measurement; bars show SD. (Q) There is only a small reduction in the number of Lhx2 + VZ cells in NrCAM KO mice across the posterior region (p = 0.002; unpaired t-test) (n = 3 mice/genotype). (R) There is a small increase in TH-positive cells in NrCAM KO mice in the ME/AME (AME p = 0.0044; ME p = 0.0390) (n = 3 mice/genotype). Statistical significance denoted in charts by asterisks: *p < 0.05, **p < 0.01.

