FIGURE 5.
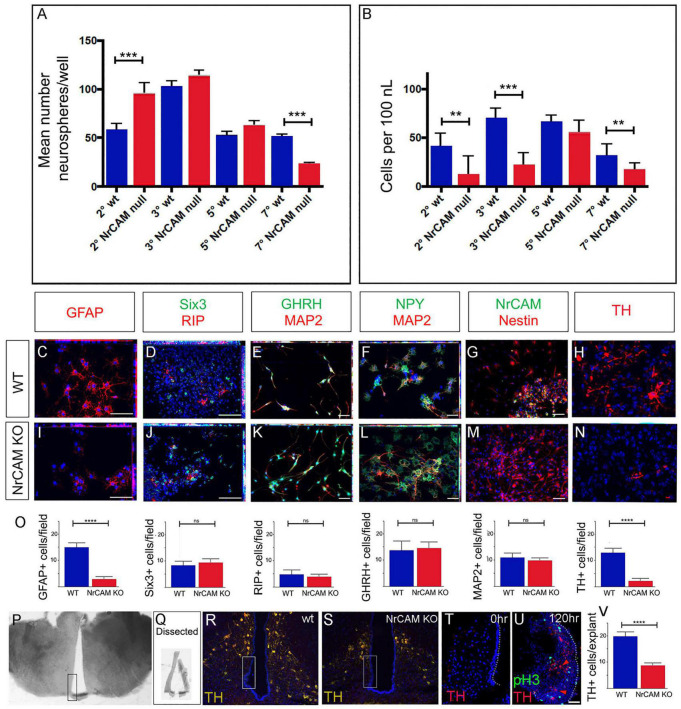
Decreased proliferation/differentiation of NrCAM-derived VZ/SVZ tissues. (A) Average number neurospheres/well number in wild-type and NrCAM KO mice. The number of neurospheres from NrCAM null mice is significantly increased at passage 2 (p = 0.0006) and is significantly decreased at passage 7 (p ≤ 0.0001). Error bars show SE (n = 6–12 wells; 3 mice each). (B) The number of cells per ml cultured from wild type and NrCAM KO mice (calculated by dissociation of neurospheres from 12 wells). Neurospheres from NrCAM KO have a reduced number of cells per ml than wild type at passage 2, 3 and 7. Error bars show SE. (C–O) Fields of view (C–N) of neurospheres from passage 6, subject to differentiation conditions and analyzed by immunohistochemistry after 7 days (C–G,I–M) or 14 days (H,N). Neurospheres from wild-type (C–H) and NrCAM KO littermates (I–N) show a similar range of differentiated cells. Quantitative analyses (O) show significantly fewer GFAP-positive astrocytes (unpaired t-test, p < 0.0001) and significantly fewer TH-positive neurons (unpaired t-test, p < 0.0001) (n = 5 neurospheres analyzed from each of 3 replicates; 30 fields of view total). (P–V) Dissection and culture of 10 week hypothalamic tanycytes. (P) A 100 μm thick slice through the region of the ME. Boxed region shows dissected area. (Q) Examples of dissected hypothalamic VZ. (R,S) Boxed regions show approximate position of dissected VZ in wild-type and NrCAM KO mice. (T) Representative example of a 15 μm section through a VZ explant at t = 0 h, immunolabeled with anti-TH. No TH-positive cells are detected. (U) Representative example of a 15 μm section through a VZ explant at t = 120 h, immunolabeled with anti-TH and anti-phosH3. (U) Quantitative analyses show significantly fewer TH-positive neurons after culture of VZ explants from NRCAM KO mice (unpaired t-test, p < 0.0001) (n = 10 explants/genotype, from 3 mice). Bars show SE. Statistical significance denoted in charts by asterisks: **p < 0.01, ***p < 0.001, ****p < 0.0001. Scale bars: 50 μm.

