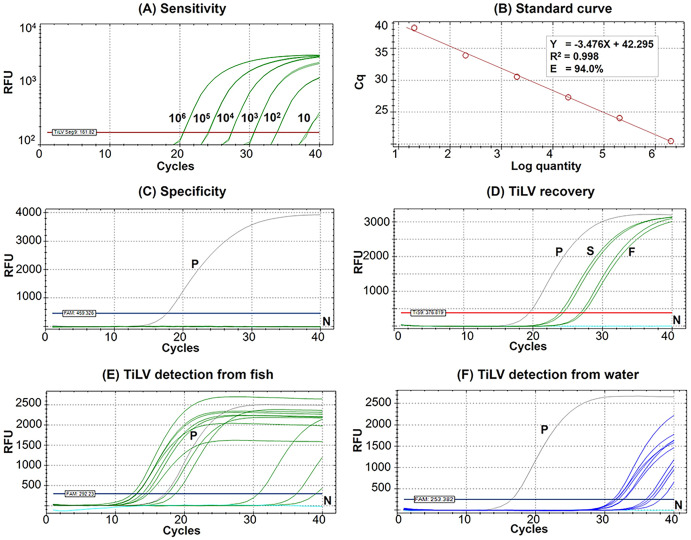
Figure 2. Performance of the newly established probe-based RT-qPCR detection of TiLV genomic segment 9.
(A) Analytical sensitivity assay determined using serial dilutions of plasmid DNA containing a 351-bp TiLV segment 9 insert. Amplification results were from two technical replicate tests. (B) A standard curve was derived from the assays in (A) showing an amplification efficiency (E) of 94.0%. (C) Analytical specificity test of the RT-qPCR protocol against RNAs extracted from common pathogens of fish and healthy-looking tilapia as listed in Table S1. (D) TiLV quantification from template extracted from stock virus (S) and flocculate-trapped filters (F) with resuspension step using two replicates. (E) TiLV quantification from fish samples collected from an outbreak open cage. (F) TiLV quantification from water samples collected from an outbreak open cage. P, positive control; N, no template control; RFU, relative fluorescence units.

