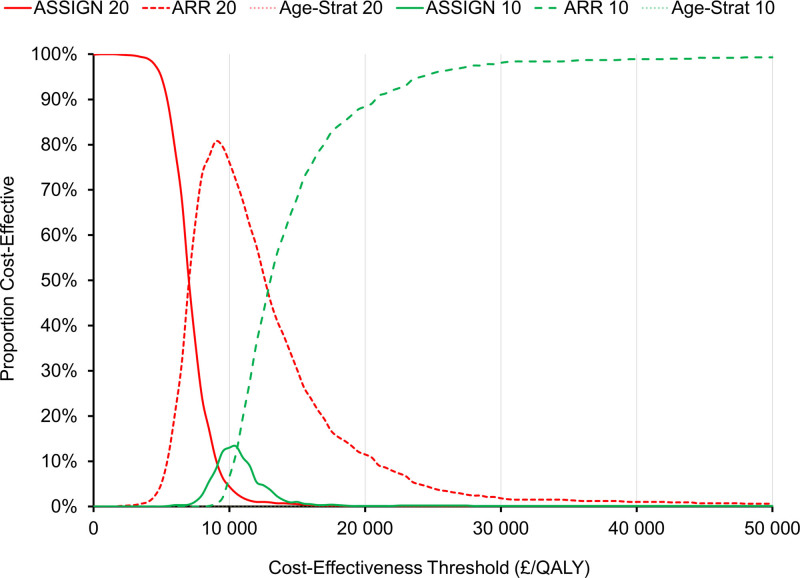
Figure 3.
Cost-effectiveness acceptability curves for all treatment strategies. The curves for age-stratified risk threshold 10 and age-stratified risk threshold 20 are indistinguishable from the 0% line. ARR indicates absolute risk reduction; ASSIGN 10, individuals with an ASSIGN score ≥10%; ASSIGN 20, individuals with an ASSIGN score ≥20; and QALY, quality-adjusted life-year.

