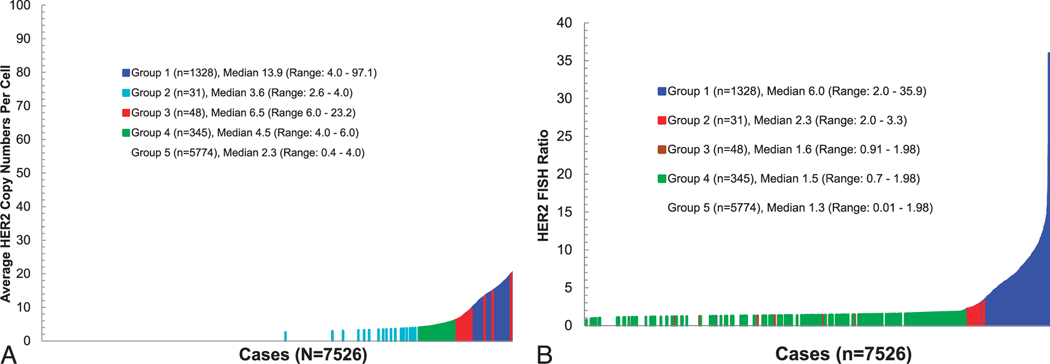
Figure 4.
Distribution of average HER2 gene copy number and HER2 fluorescent in situ hybridization (FISH) ratios among 7526 breast cancers evaluated in an academic private practice. A, Plot of average HER2 gene copy number per tumor cell nucleus from lowest to highest, but with cases identified according to the American Society of Clinical Oncology/College of American Pathologists (ASCO-CAP) guidelines as groups 1 (blue), 2 (turquoise), 3 (red), 4 (green), and 5 (no color). Please note that no color was assigned to group 5 cases because doing so in such a large group obscures the colors of some cases from less frequent groups, especially group 2. B, Plot of HER2 FISH ratios arranged from lowest to highest with identification of ASCO-CAP groups 1 (blue), 2 (red), 3 (brown), 4 (green), and 5 (no color). Please note that no color was assigned to group 5 cases because doing so in such a large group obscures the colors of some cases from less frequent groups, especially groups 2, 3 and 4.

