Figure 1.

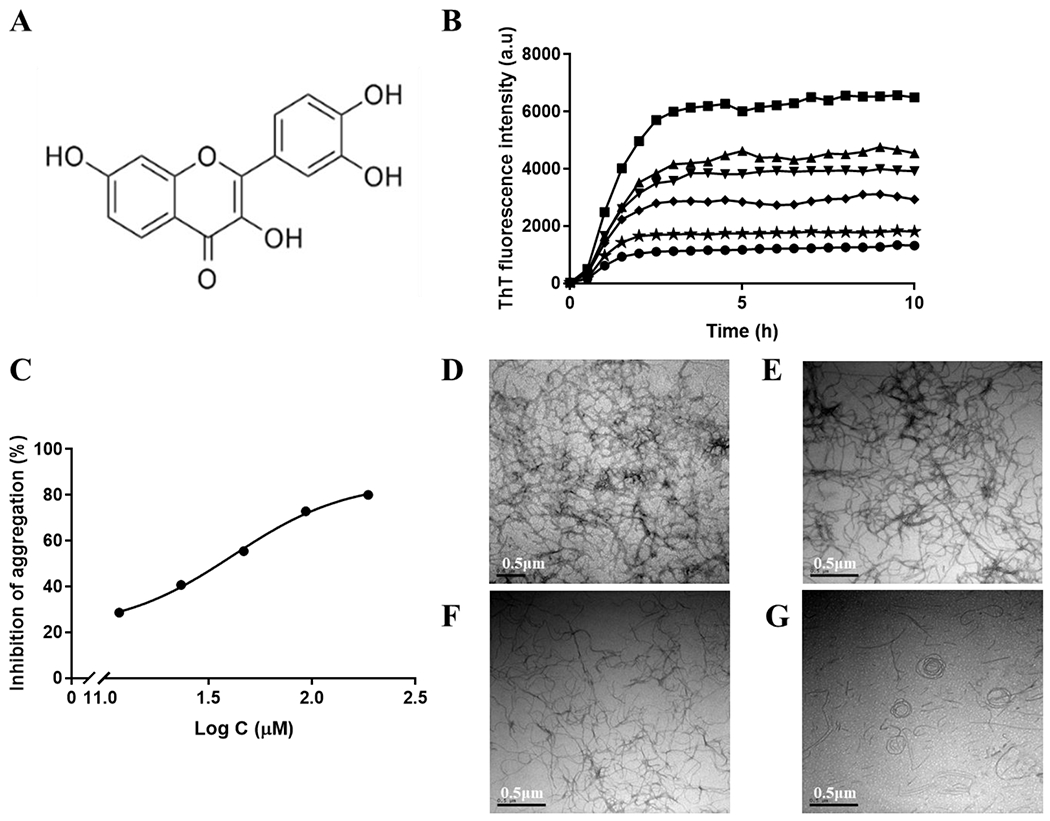
(A) The chemical structure of fisetin. (B) Curves of ThT fluorescence as a function of time with different concentrations of fisetin (0 μM (■), 11.7 μM (▴), 23.3 μM (▼), 46.7 μM (♦). 93.3 μM (★) and 186.7 μM (•)) Each sample contains 75 μM tau K18, 24 μM heparin, and 60 μM ThT in 5% DMSO, 50mM Tris and 100mM NaCl buffer, pH 7.4. (C). Curve of percentages of inhibition as a function of logarithm of fisetin concentration. (D) TEM image of tau K18 final aggregates without fisetin. (E) TEM image of tau K18 final aggregates with 11.7 μM fisetin. (F) TEM image of tau K18 final aggregates with 46.7 μM fisetin. (G) TEM image of tau K18 final aggregates with 186.7 μM fisetin. Scale bar = 0.5 μm.
