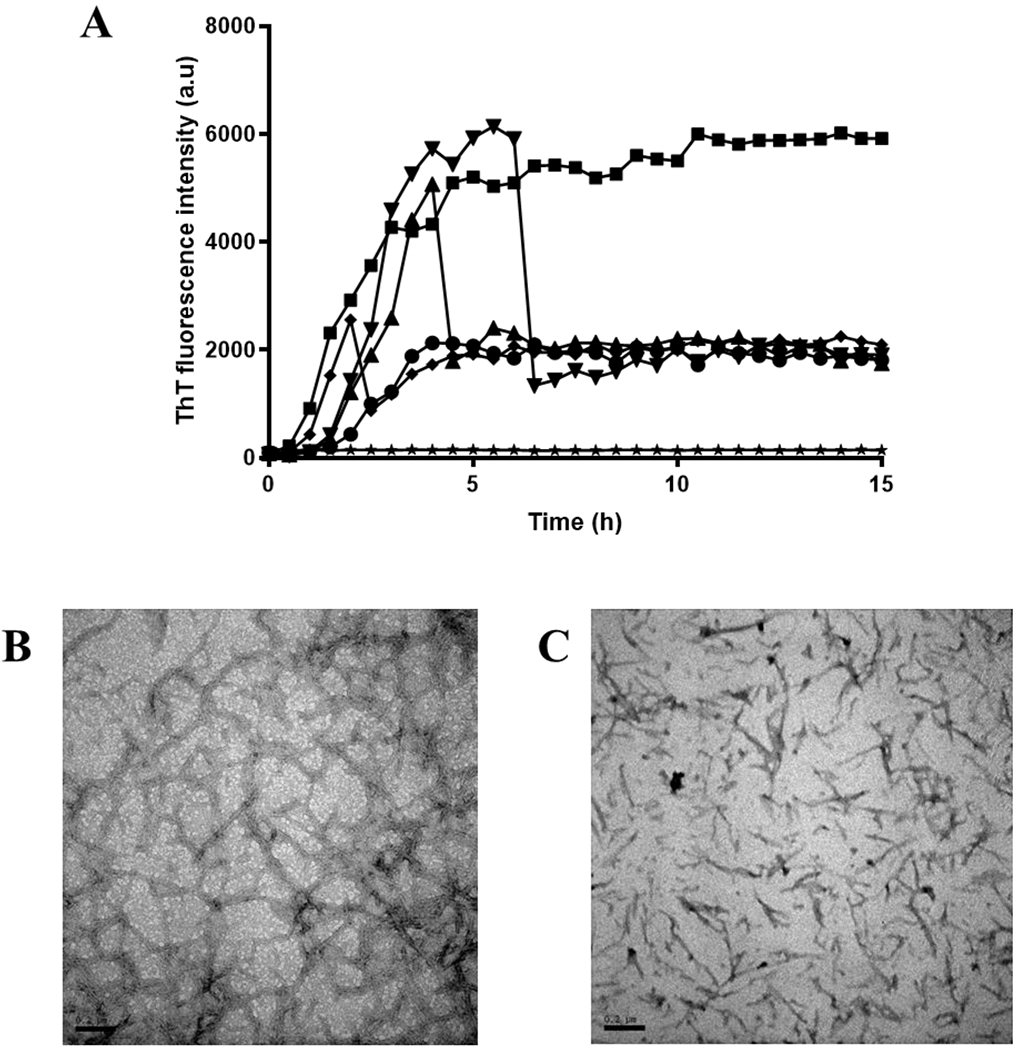
Figure 2.

(A) Curves of ThT fluorescence as a function of time with fisetin added at different times (0 hour (•), 2 hours (♦). 4 hours (▴), 6 hours (▼)) while ■ and ★ represent the tau K18 alone and fisetin alone respectively. Each sample contains 75 μM tau K18, 24 μM heparin, and 60 μM ThT in 5% DMSO, 50mM Tris and 100mM NaCl buffer, pH 7.4. (B) TEM image of tau K18 final aggregates without fisetin. (C) TEM image of tau K18 final aggregates with fisetin added at 6 hours. Scale bar = 0.2 μm.
