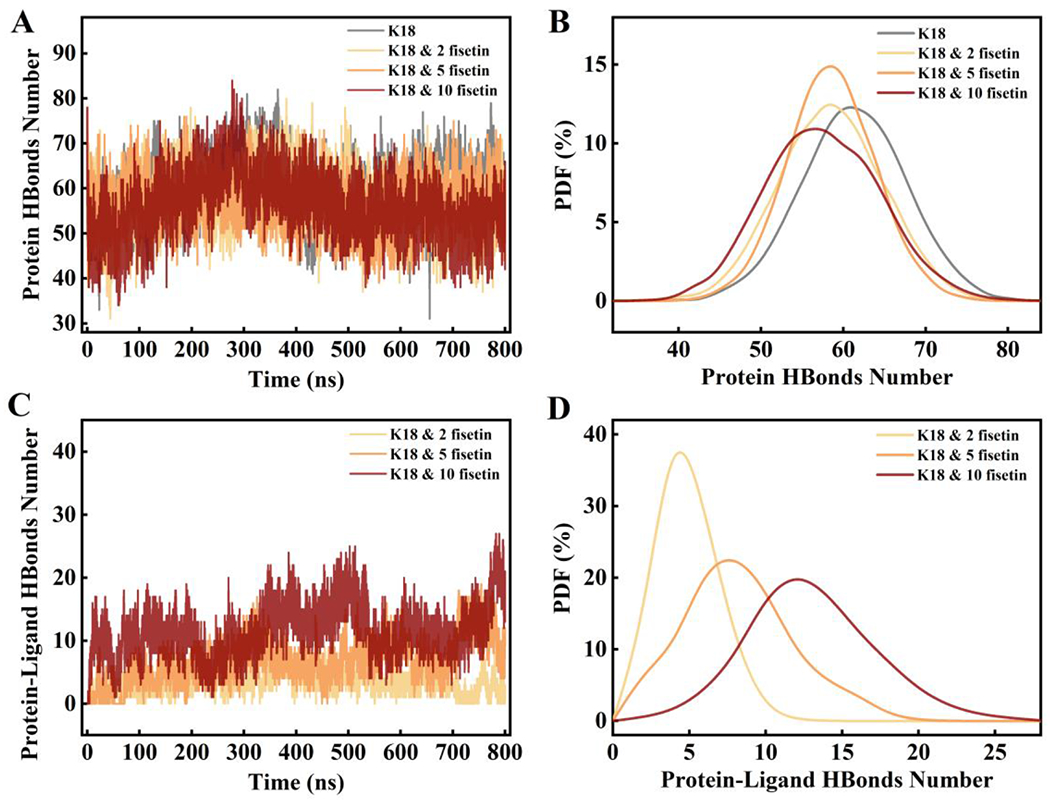
Figure 8.

(A) The number of hydrogen bonds formed within the protein during the simulations in the four systems; (B) the probability density distribution curves of hydrogen bond number from trajectories in A; (C) The number of hydrogen bonds formed between K18 and fisetin during the simulations; (D) the probability density distribution curves of hydrogen bond number from trajectories in C. A cutoff of 3.5 Å in distance (donor-acceptor) and 30° in angle (hydrogen-donor-acceptor) was used to define the hydrogen bond.
