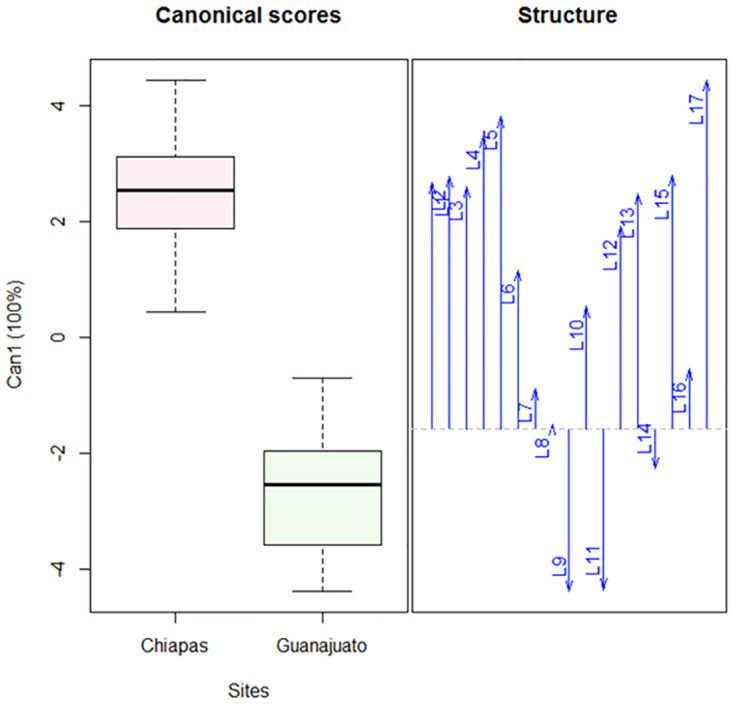
Fig 3. Canonical discriminant analysis of the morphological variables of Polyphagotarsonemus latus (females).

The box-and-whisker plot shows a difference between both populations; arrows indicate the correlation: L9, L11 and L14 are negatively correlated and affect the separation between the populations. The key to the abbreviations can be found in Materials and methods (Morphological and biometric study).
