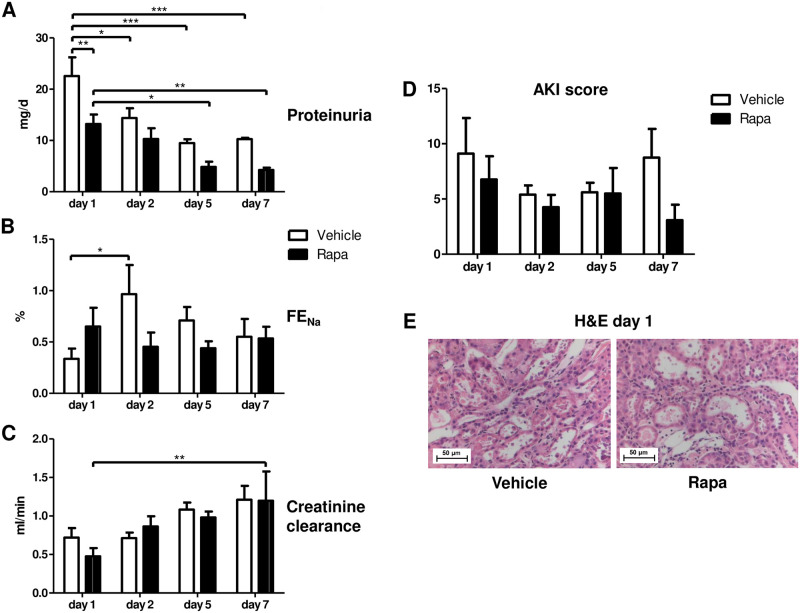
Fig 5. Functional and structural recovery during the first 7 days after kidney transplantation in vehicle and Rapa treated rats.
(A) Proteinuria measured over 24 h. n = 4–5. (B) Fractional excretion of sodium (FENa) given in %. n = 4–6. (C) Creatinine clearance calculated from a 24-h urine collection. n = 3–5. (D) Acute kidney injury (AKI) score representing the mean percentage of tubular cross sections affected with tubular dilatation, basal membrane denudation, loss of the brush border, tubular cell flattening, tubular cell vacuolization, and tubular casts. n = 3–6. *P<0.05, **P<0.01, ***P<0.001. (E) Representative photomicrographs from hematoxylin and eosin (H&E) stained kidney sections from vehicle and Rapa treated animals on day 1 after transplantation.

